MarkLogic 9 Product DocumentationOps Director Guide — Chapter 6
ANALYZE View
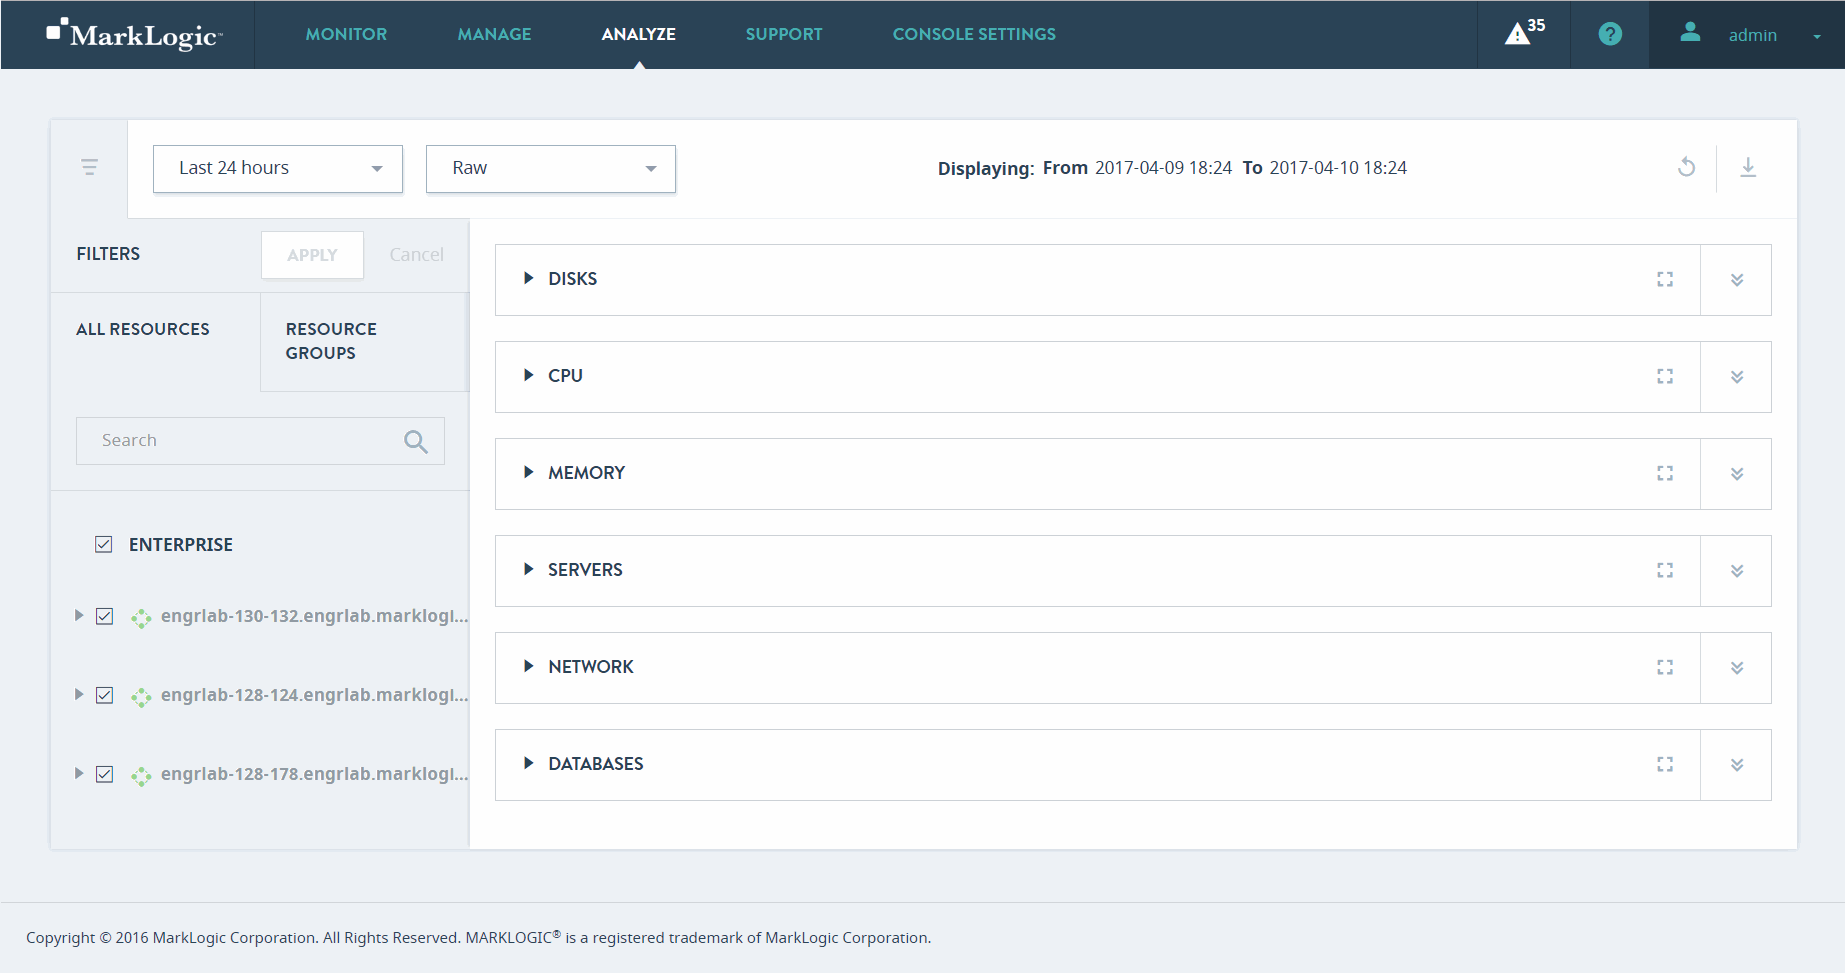
The ANALYZE view presents a comprehensive set of detailed charts that allow to analyze utilization and performance of system resources in your enterprise, such as disks, CPU, memory, network, databases, and servers.
This chapter covers the following topics:
Configuring and Navigating the ANALYZE View
Use the ANALYZE view to examine key performance indicators of various system resources, such as disks, CPU, memory, network, databases, and servers.
This section describes the general mechanisms for configuring and navigating the ANALYZE view.
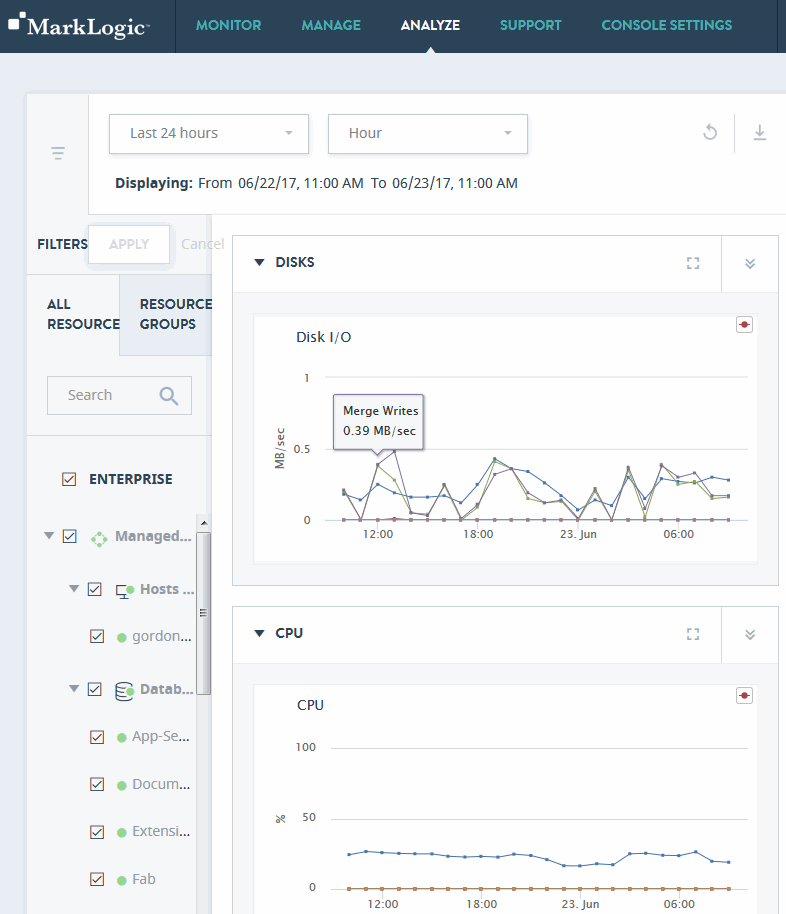
Performance metrics are displayed in the central panel of the ANALYZE view.
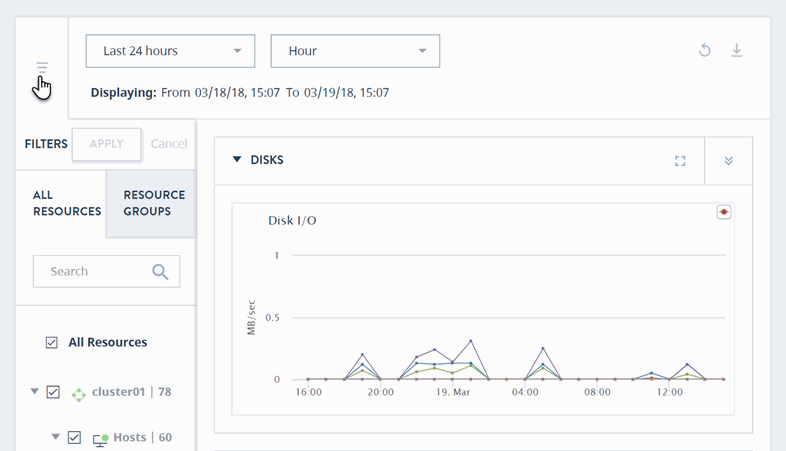
Use the date picker to select the date/time range to inspect. Use the resources panel to select which resources to examine.
Toggle between a normal or expanded view of the data charts by selecting the chart-only icon beside the date filters.
Select which resources to examine by defining corresponding filters in the resources panel. You can use the search bar to restrict the list of resources to only those matching your specified keywords. These features are described in Navigating and Filtering Ops Director Views.
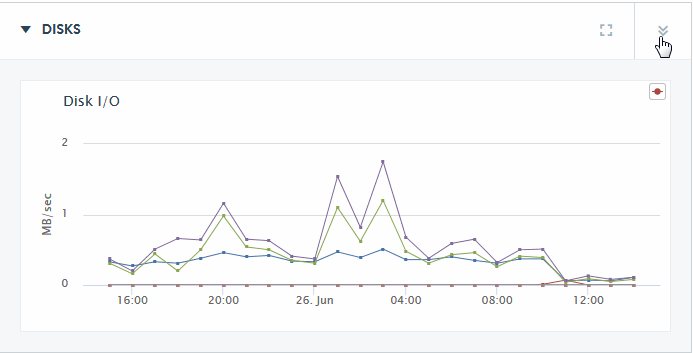
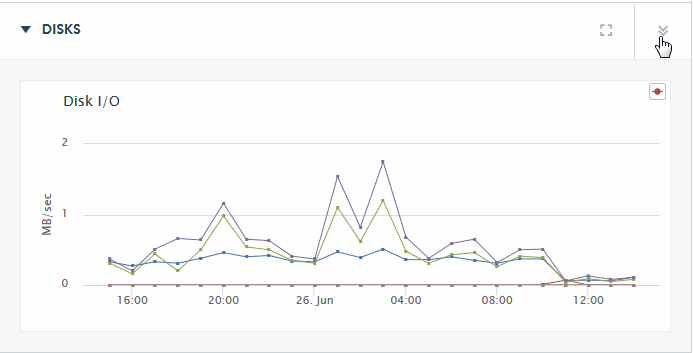
Drill down for greater detail by selecting the detail icon at the far right side of any top-level section of the Overview page.
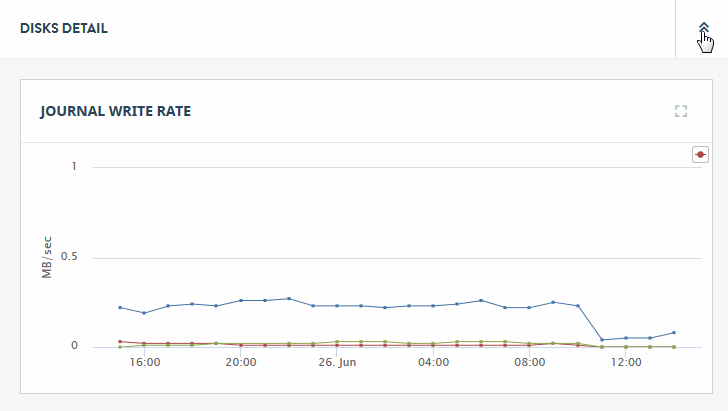
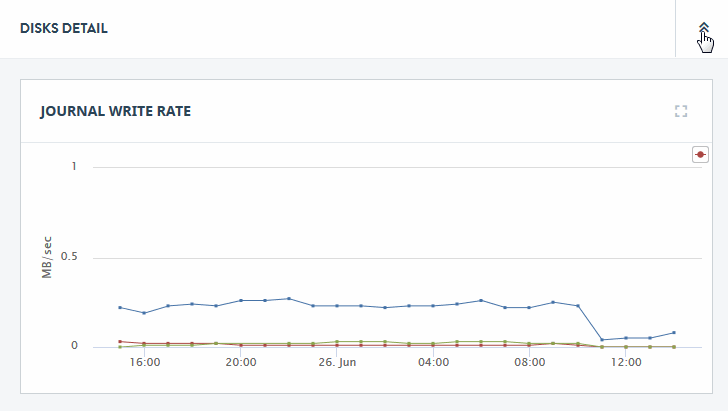
The DISKS DETAIL page, for example, offers greater detail of the disk operational parameters.
To return to the Overview page from a DISKS DETAIL page, click on the detail icon at the upper right-hand section of the resource graph on the Detail page.
You may export data from the charts presented in the ANALYZE view by clicking the Export icon in the upper right corner.
As the result, a zip file with all exported metrics from the charts will be downloaded to your computer. The following rules apply:
- The zip file contains one CSV (Comma Separated Values) file for each plot (such as data series) across all charts in the view.
- The CSV files are grouped into folders by resource type:
Host,Database,Server, andForest. - Each CSV file corresponds to one exported metric and has two columns: one for the timestamp and another for the chart data.
Metrics exported for the Host resource type are described in the following sections:
Thus, the Host folder in the zip file will contain CSV files that correspond to these metrics.
Metrics exported for the Database resource type are described in the section Database Performance Data.
Thus, the Database folder in the zip file will contain CSV files that correspond to these metrics.
Metrics exported for the Server resource type are described in the section Server Performance Data. Thus, the Server folder in the zip file will contain CSV files that correspond to these metrics.
Metrics exported for the Forest resource type are described in the following sections:
Thus, the Forest folder in the zip file will contain CSV files that correspond to these metrics.
You may export metrics also from the second-level pages in the ANALYZE view:
- If you click the Export icon from the DISKS DETAIL page, the resulting zip file will contain only
HostandForestfolders. - If you click the Export icon from the CPU DETAIL page, the resulting zip file will contain only
HostandForestfolders. - If you click the Export icon from the MEMORY DETAIL page, the resulting zip file will contain only
HostandForestfolders. - If you click the Export icon from the SERVERS DETAIL page, the resulting zip file will contain only
Serverfolder. - If you click the Export icon from the NETWORK DETAIL page, the resulting zip file will contain only
HostandForestfolders. - If you click the Export icon from the DATABASES DETAIL page, the resulting zip file will contain only
Databasefolder.
You may export metrics for selected resources and/or apply date filters:
- If you select some resources in the ALL RESOURCES tab of the left-hand navigation panel, click Apply to apply the new selection, and then click the Export icon, the resulting zip file will contain CSV files with content pertaining to the resources selected.
- If you select some resources in the RESOURCE GROUPS tab of the left-hand navigation panel, click Apply to apply the new selection, and then click the Export icon, the resulting zip file will contain CSV files with content pertaining to the resources selected.
- If you filter the ANALYZE view by selecting date/time range, click Apply to apply the new filtering, and then click the Export icon, the resulting zip file will contain CSV files with content pertaining to the resources that are visible with the applied filter.
You may then import the CSV files into other applications (such as Excel) for further processing or analysis.
Performance Charts by Resource
The ANALYZE view offers overview and detailed performance metrics in graph form for each resource in the cluster. In the Overview page, the lines on a graph represent an aggregate of the metrics for all of the cluster resources of that type. In each Detail page, the lines represent the metric for each specific resource in the cluster.
This section describes the Overview and Detail pages for the following resources:
- Disk Performance Data
- CPU Performance Data
- Memory Performance Data
- Server Performance Data
- Network Performance Data
- Database Performance Data
Disk Performance Data
The DISKS section of the Overview page displays a graph of the aggregate I/O performance data for the disks used by the hosts selected in the filter.
You can hover on a period point to view what disk operation was taking place at that point in time. Each performance metric is described in the following table.
| Metric | Description |
|---|---|
| Writes | The disk I/O performance (in MB/sec) during journal and save write operations. This is the sum of journal-write-rate, save-write-rate, and large-write-rate. For more information, see the Query Performance and Tuning Guide. |
| Query Traffic | The disk I/O performance (in MB/sec) during a query or queries. This is is the sum of query-read-rate and large-read-rate. For more information, see the Query Performance and Tuning Guide. |
| Merge Reads | The disk I/O performance (in MB/sec) during a merge read operation. For more information on merging, see Understanding and Controlling Database Merges in the Administrator's Guide. |
| Merge Writes | The disk I/O performance (in MB/sec) during a merge write operation. For more information on merging, see Understanding and Controlling Database Merges in the Administrator's Guide. |
| Backup Reads | The disk I/O read performance (in MB/sec) during a backup operation. For more information on database backup, see Backing Up and Restoring a Database in the Administrator's Guide. |
| Backup Writes | The disk I/O write performance (in MB/sec) during a backup operation. For more information on database backup, see Backing Up and Restoring a Database in the Administrator's Guide. |
| Restore Reads | The disk I/O read performance (in MB/sec) during a restore operation. For more information on database restore, see Backing Up and Restoring a Database in the Administrator's Guide. |
| Restore Writes | The disk I/O read performance (in MB/sec) during a restore operation. For more information on database restore, see Backing Up and Restoring a Database in the Administrator's Guide. |
Click on the detail icon in the upper right-hand section of the DISKS section of the Overview page to view charts that present more detailed disk performance metrics.
The rate metrics displayed by the charts on the DISKS DETAIL page are described in the following table. For guidelines on how to interpret rate metrics, see Assess MarkLogic Cluster Performance.
| Chart | Definition of Displayed Metric |
|---|---|
| Journal Write Rate | The moving average of data writes (in MB/sec) to the journal. |
| Save Write Rate | The moving average of data writes (in MB/sec) to in-memory stands. |
| Query Read Rate | The moving average of reading query data (in MB/sec) from disk |
| Merge Read Rate | The moving average of reading merge data (in MB/sec) from disk |
| Merge Write Rate | The moving average of writing data (in MB/sec) for merges |
| Backup Read Rate | The moving average of reading backup data (in MB/sec) to disk. |
| Backup Write Rate | The moving average of writing backup data (in MB/sec) to disk. |
| Restore Read Rate | The moving average of reading restore data (in MB/sec) from disk. |
| Restore Write Rate | The moving average of writing restore data (in MB/sec) from disk. |
| Large Binary Read Rate | The moving average of reading large documents (in MB/sec) from disk. For more information, see Working With Binary Documents in the Application Developer's Guide. |
| Large Binary Write Rate | The moving average of writing data for large documents (in MB/sec) to disk. For more information, see Working With Binary Documents in the Application Developer's Guide. |
CPU Performance Data
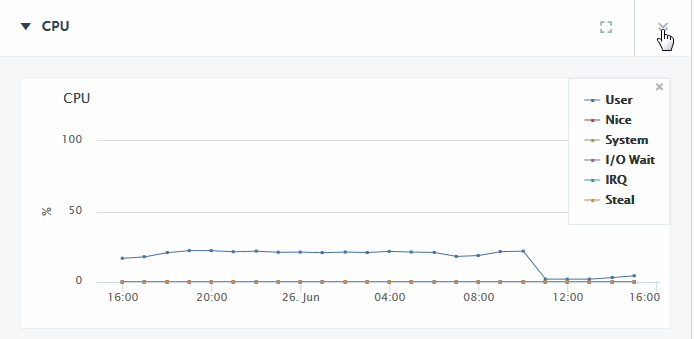
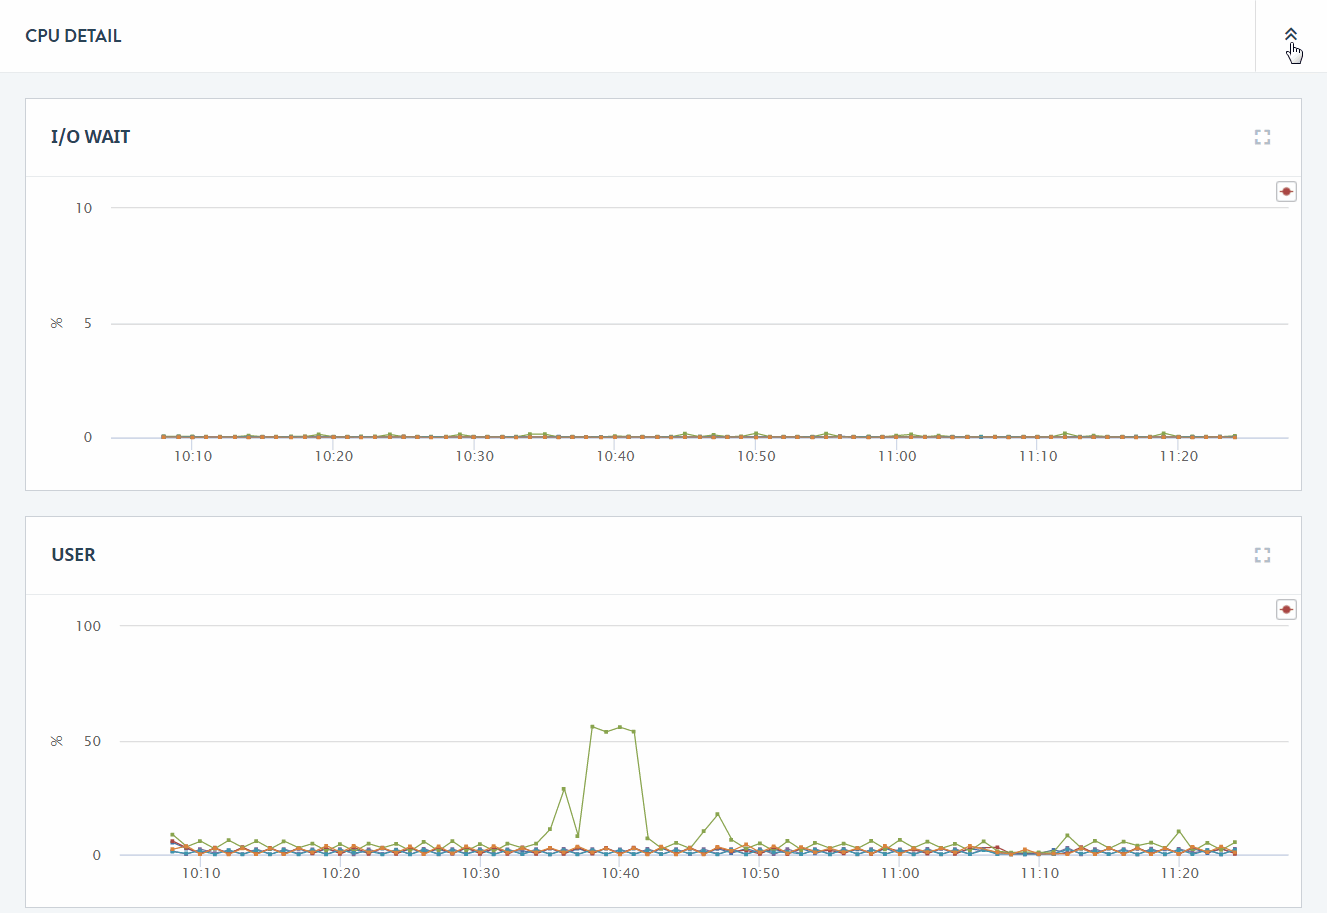
The CPU section of the Overview page displays a graph of the aggregate I/O performance data for the CPUs used by the hosts selected in the filter.
CPU metrics are not supported on the Mac OS X platform and are only partially supported on Windows.
Each performance metric in the CPU section of the Overview page is described in the following table.
Click on the detail icon to view graphs that present more detailed CPU performance metrics.
The charts on the CPU Detail page are described in the following table.
Memory Performance Data
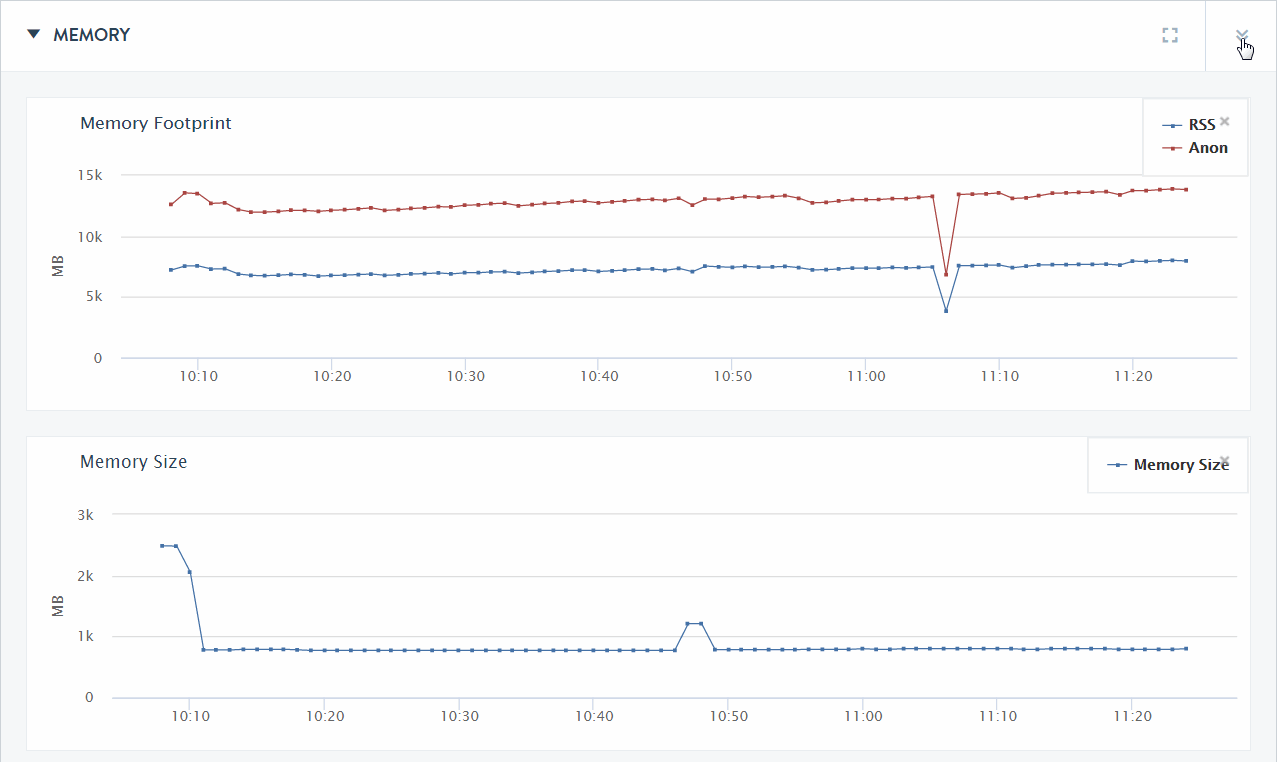
The MEMORY section of the Overview page displays a graph of the aggregate performance data for the Memory used by the hosts selected in the filter.
CPU metrics are not supported on the Mac OS X platform and are only partially supported on Windows.
You can hover on a period point to view which CPU operation was taking place at that point in time. Each chart and associated performance metrics are described in the following table.
Click on the detail icon to view graphs that present more detailed CPU performance metrics. The charts on the Memory Detail page are described in the following table. The displayed metrics are drawn from /proc/vmstat.
Server Performance Data
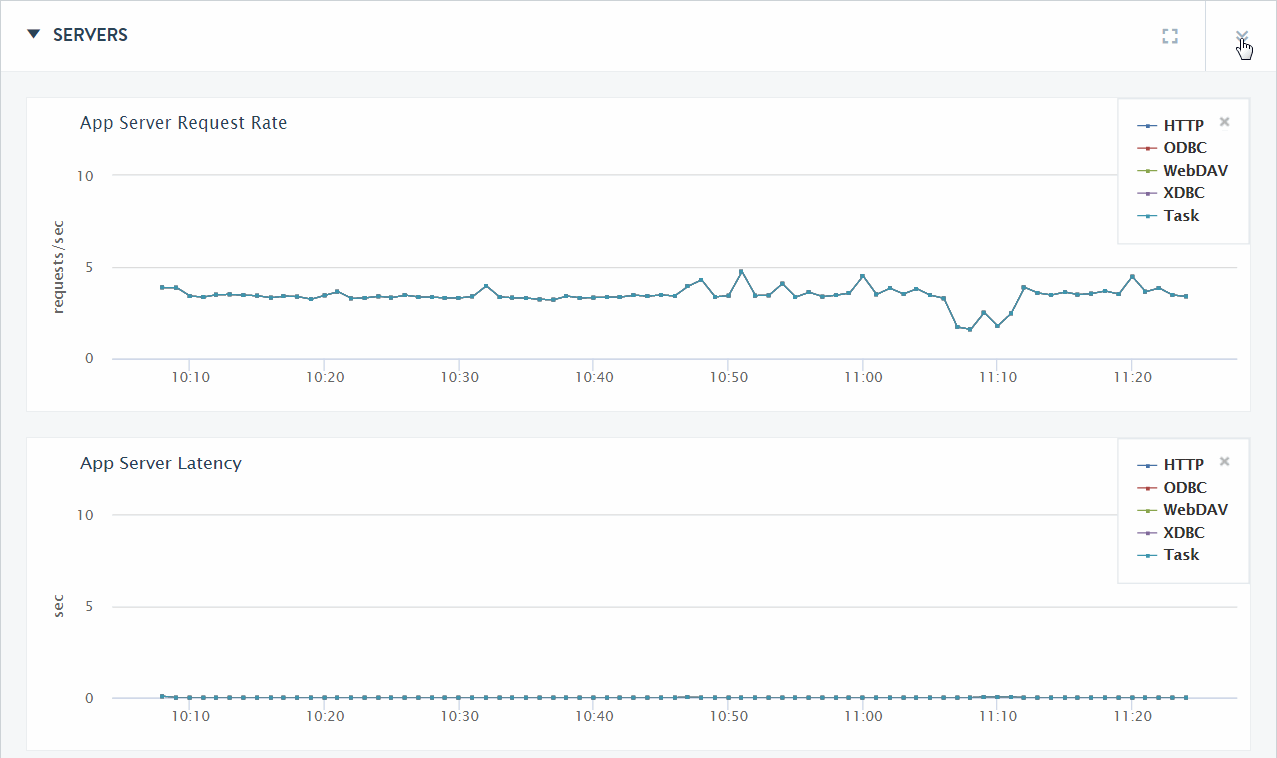
The SERVERS section of the Overview page displays graphs of the aggregate performance data for the App Servers selected in the filter.
The Servers Overview page displays the charts described in the following table.
With the exception of the Task Server Queue Size chart, which only displays the queue size for the one task server, the color-coded metrics for the server charts are as shown in the following table.
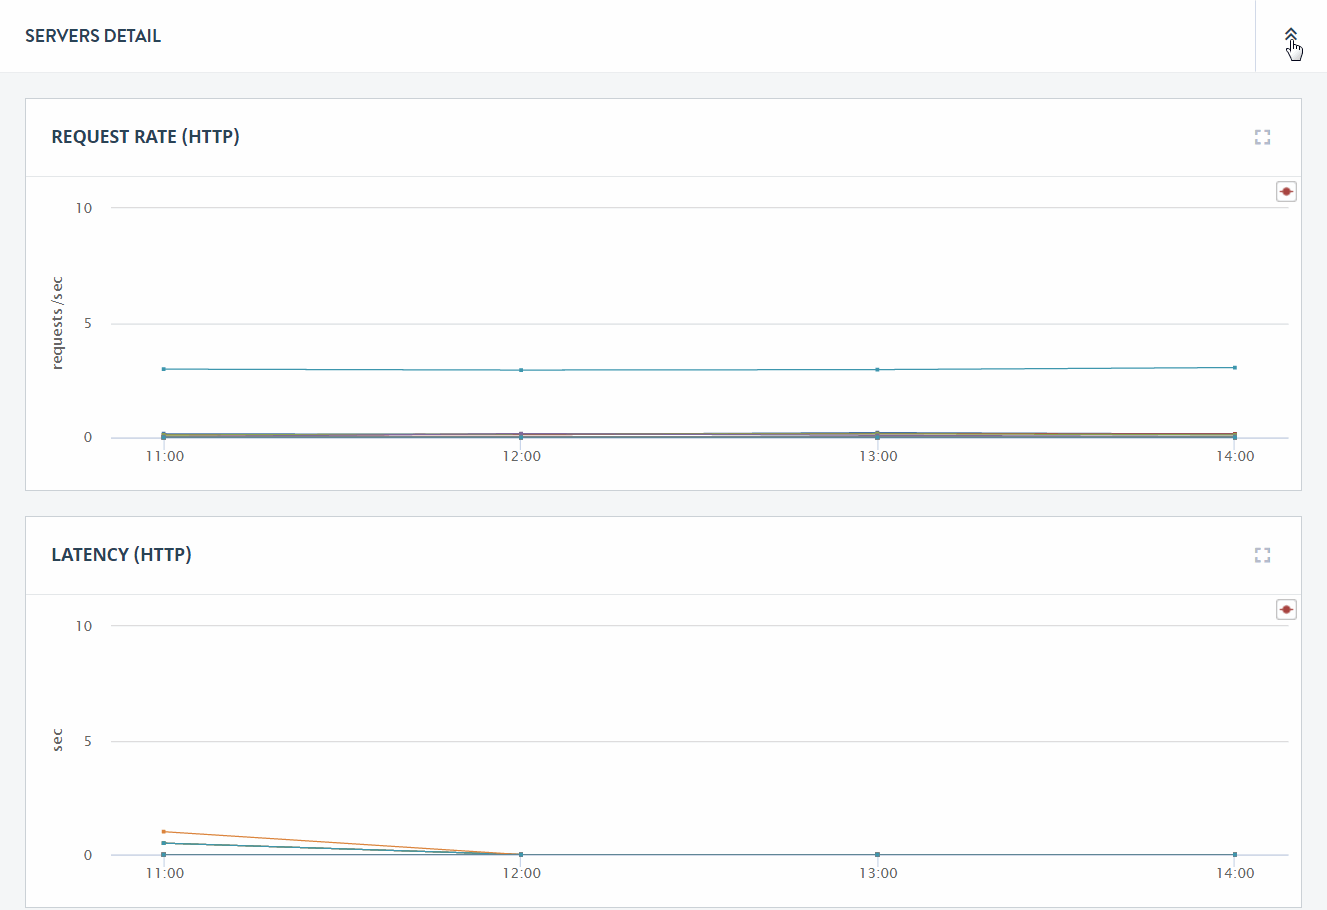
Click on the detail icon to view graphs that present more detailed performance metrics for each App Server. The charts displayed on the SERVERS DETAIL page are described in the following table.
The server type (for example, ODBC) is shown in the upper right-hand section of each server type group.
The following repeating pattern of detailed charts are displayed for each of HTTP, XDBC, ODBC, Task, and WebDAV App Servers:
Network Performance Data
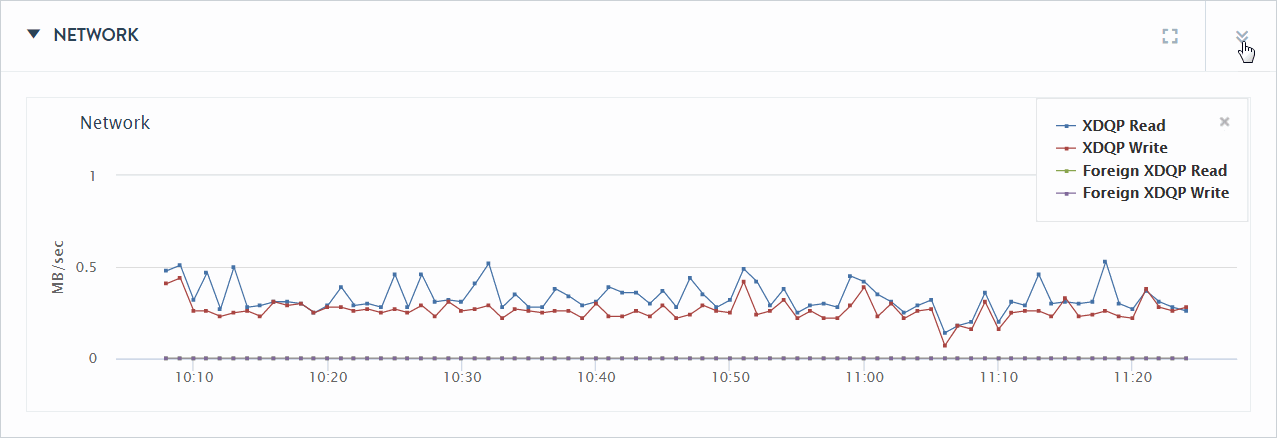
The network performance data graphs display performance in terms of XDQP reads and writes. XDQP is the protocol MarkLogic uses for internal host-to-host communication on port 7999.
The Network section of the Overview page displays various XDQP performance as the sum of XDQP activity across the cluster. High XDQP rates are usually not an issue unless they are so high as to saturate your internal network. Higher usage occurs during data load and query execution. Merges do not involve XDQP.
If XDQP indicates excessively high during loads, running the MarkLogic Content Pump (mlcp) with fast forest placement will minimize XDQP communication needs. For details on the MarkLogic Content Pump, see Loading Content Using MarkLogic Content Pump in the Loading Content Into MarkLogic Server Guide.
The Network section of the Overview page displays a chart with the metrics described in the following table.
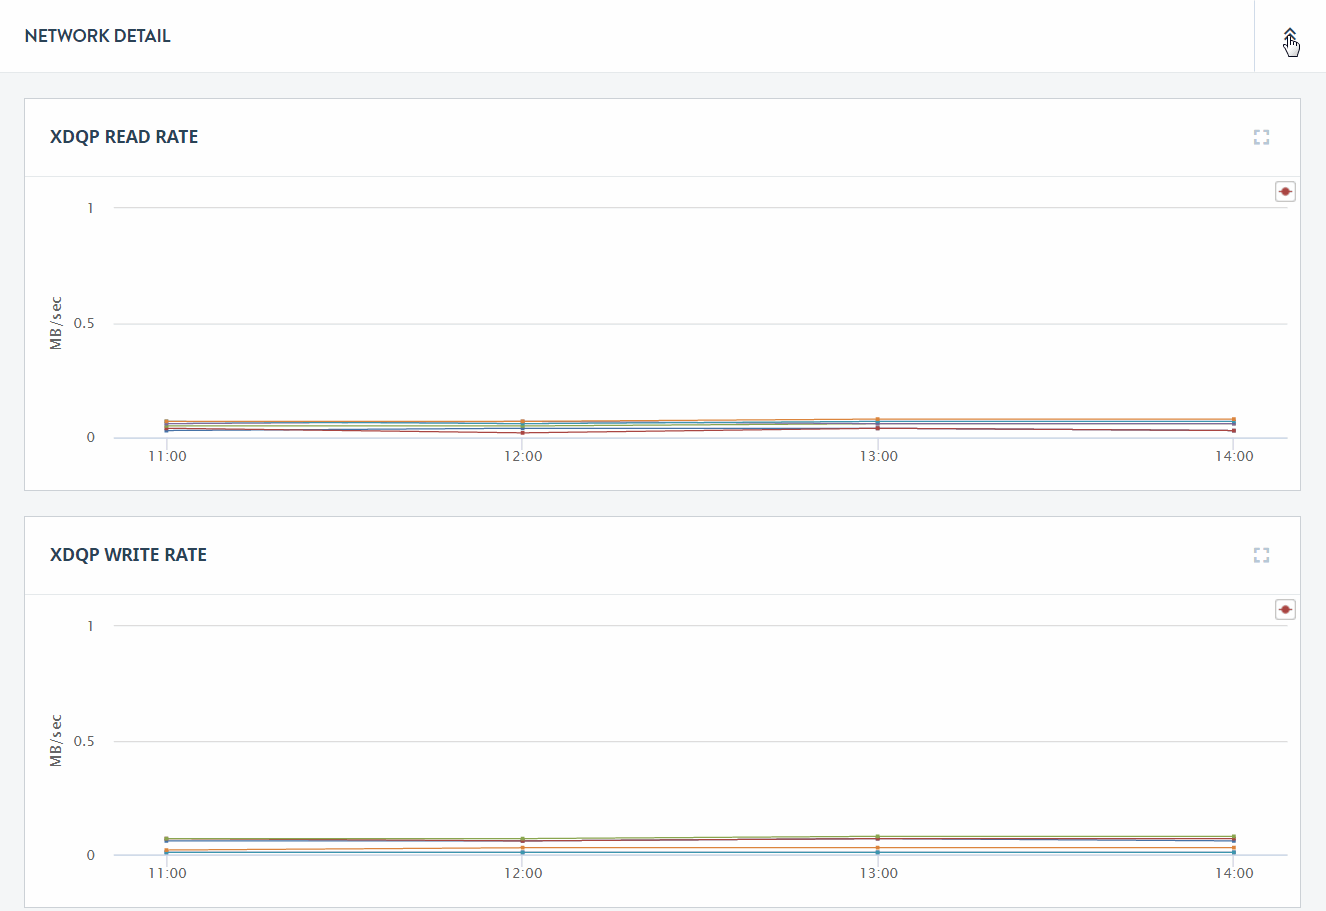
Click on the detail icon to view graphs that present more detailed performance metrics for each host in the cluster.
The charts displayed on the Network Detail page are described in the following table.
Database Performance Data
Disk space usage is a key monitoring metric. In general, forest merges require twice as much disk space than that of the data stored in the forests. If a merge runs out of disk space, it will fail. In addition to the need for merge space on the disk, there must be sufficient disk space on the file system in which the log files reside to log any activity on the system. If there is no space left on the log file device, MarkLogic Server will abort. Also, if there is no disk space available to add messages to the log files, MarkLogic Server will fail to start.
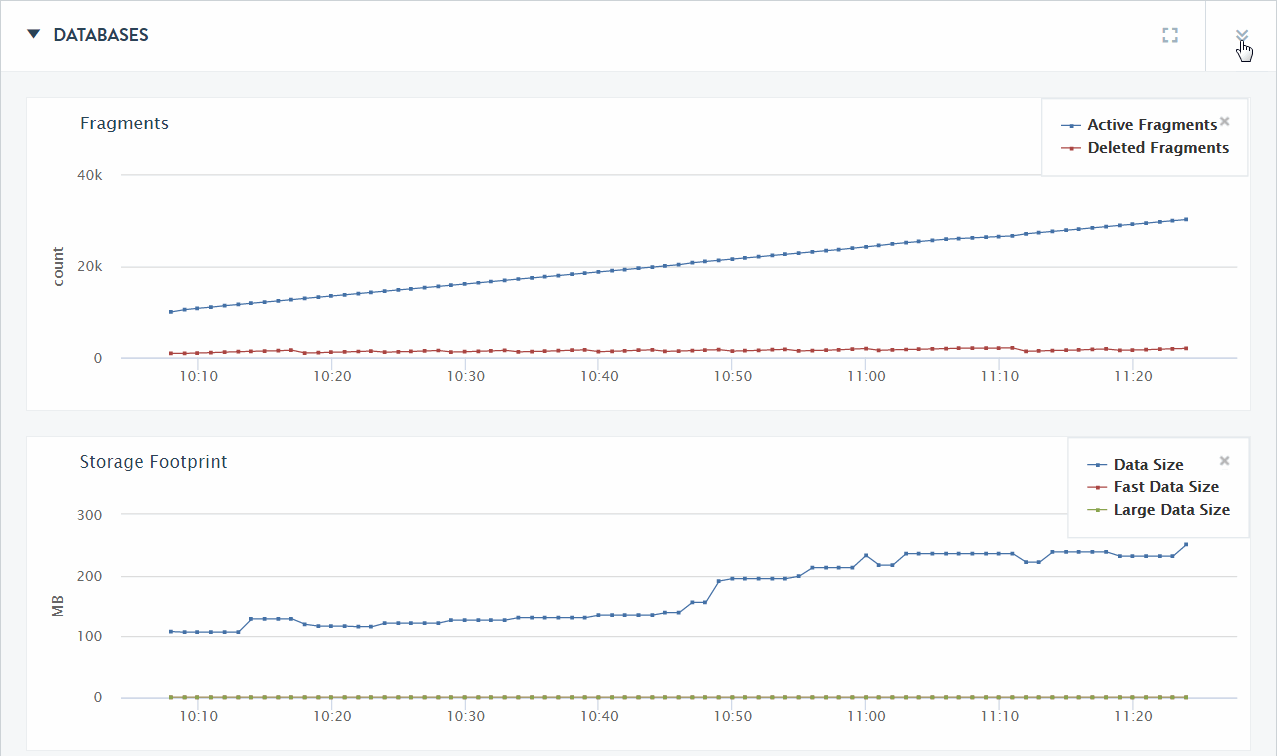
The DATABASES section of the Overview page displays graphs of the aggregate performance data for all of the databases in the cluster.
The following table describes the lines displayed in the DATABASES section of the Overview page.
| Chart | Description |
|---|---|
| Fragments | Displays the aggregate number of fragments in all of the databases in the cluster. |
| Storage FootPrint | The total disk capacity (in GBs) used by all of the databases in the cluster.
|
| Lock Rate | The number of locks set per second across all of the databases in the cluster. |
| Lock Wait Load | The aggregate time (in seconds) transactions wait for locks; |
| Lock Hold Load | |
| Deadlock Wait Load | The aggregate time (in seconds) deadlocks remain unresolved. |
| Database Replication | The amount of data (in MB per second) sent by and received from this cluster and foreign clusters. |
| List Cache Hits/Misses | The displayed lines are: |
| Compressed Tree Cache Hits/Misses | The displayed lines are: |
| Triple Cache Hits/Misses | The displayed lines are: |
| Triple Value Cache Hits/Misses | The displayed lines are: |
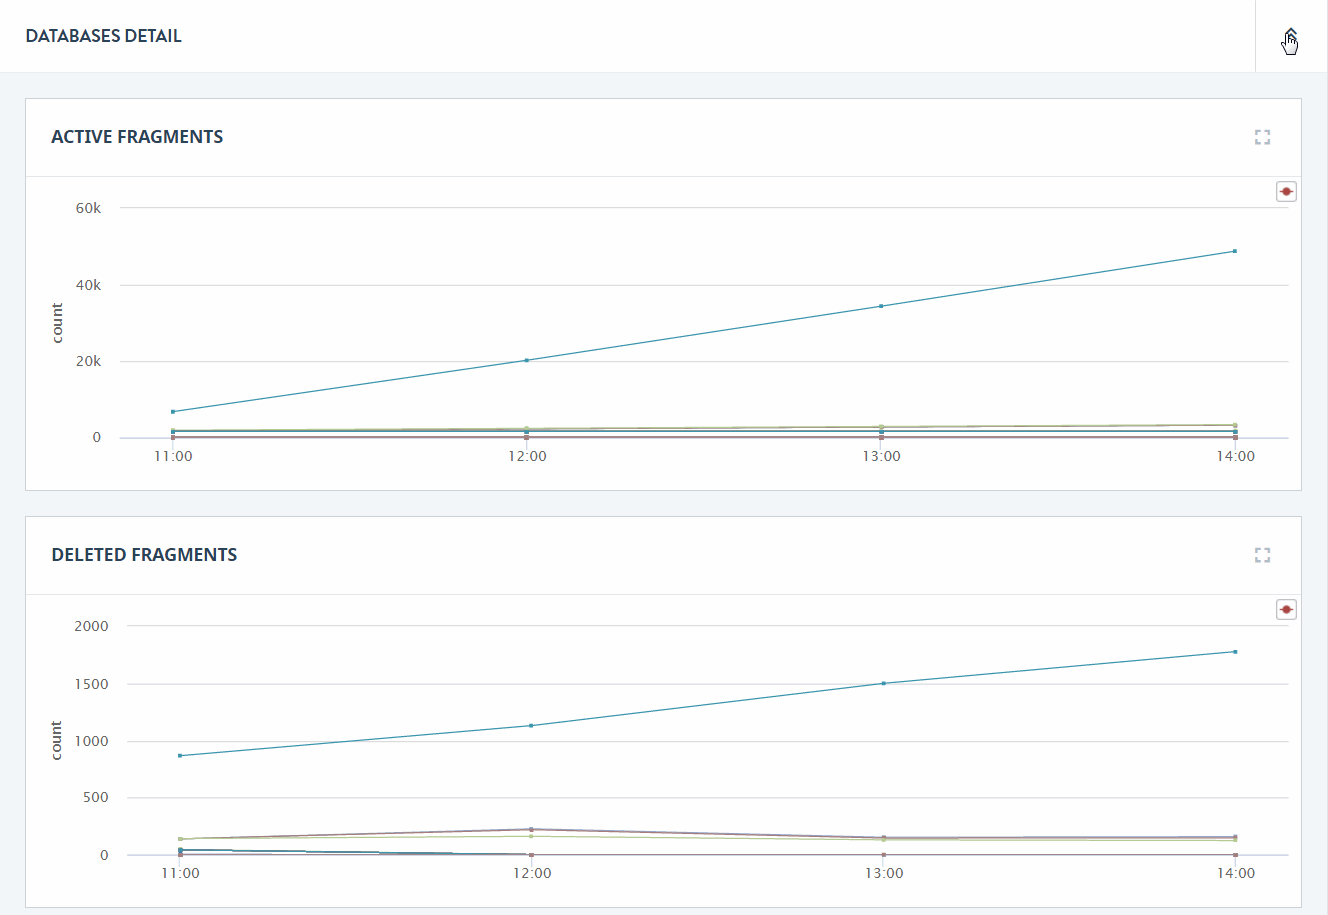
Click on the detail icon to view graphs that present more detailed performance metrics for each database.
The charts displayed on the Databases Detail page are described in the following table. The metrics for each database in the cluster are displayed as a separate line.
| Chart | Description |
|---|---|
| Active Fragments | The number of active fragments (the fragments available to queries) in each database. |
| Deleted Fragments | The number of deleted fragments (the fragments to be removed by the next merge operation) in each database. |
| Data Size | The amount of data in the data directories of the forests attached to each database. |
| Fast Data Size | The amount of data in the fast data directories of the forests attached to each database. For more information on Fast Data, see Fast Data Directory on Forests in the Query Performance and Tuning Guide. |
| Large Data Size | The amount of data in the large data directories of the forests attached to each database. For more information on Large Data, see Working With Binary Documents in the Application Developer's Guide. |
| Read Lock Rate | The rate of read lock acquisitions, summed across all forests on the host. |
| Write Lock Rate | The number of write locks set per second on each database. |
| Deadlock Rate | The number of deadlocks per second on each database. |
| Read Lock Wait Load | Time threads spent waiting for read locks in proportion to the elapsed time, summed across all forests on the host. |
| Write Lock Wait Load | The aggregate time (in seconds) transactions wait for write locks on each database. |
| Deadlock Wait Load | The aggregate time (in seconds) deadlocks remain unresolved on each database. |
| Read Lock Hold Load | The time (in seconds) read locks are held on each database. |
| Write Lock Hold Load | The time (in seconds) write locks are held on each database. |
| Database Replication Send Rate | The amount of replication data (in MB per second) sent by each database to foreign clusters. |
| Database Replication Receive Rate | The amount of replication data (in MB per second) received by each database from foreign clusters. |
| Database Replication Send Load | The time (in seconds) it takes each database to send replication data to foreign clusters. |
| Database Replication Receive Load | The time (in seconds) it takes each database to receive replication data from foreign clusters. |
| List Cache Hit Rate | The number of times per second that queries use (Hit) the expanded tree cache on each App Server. |
| List Cache Miss Rate | The number of times per second that queries could not use (Miss) the expanded tree cache on each App Server. |
| Compressed Tree Cache Hit Rate | The number of times per second that queries could use (Hit) the compressed tree cache on each App Server. For details, see Effect of External Binaries on E-node Compressed Tree Cache Size in the Application Developer's Guide. |
| Compressed Tree Cache Miss Rate | The number of times per second that queries could not use (Miss) the compressed tree cache on each App Server. For details, see Effect of External Binaries on E-node Compressed Tree Cache Size in the Application Developer's Guide. |
| Triple Cache Hit Rate | The number of times per second that queries could use (Hit) the triple cache on each App Server. For details, see Triple Cache and Triple Value Cache in the Semantics Developer's Guide. |
| Triple Cache Miss Rate | The number of times per second that queries could not use (Miss) the triple cache on each App Server. For details, see Triple Cache and Triple Value Cache in the Semantics Developer's Guide. |
| Triple Value Cache Hit Rate | The number of times per second that queries could use (Hit) the triple value cache on each App Server. For details, see Triple Cache and Triple Value Cache in the Semantics Developer's Guide. |
| Triple Value Cache Miss Rate | The number of times per second that queries could not use (Miss) the triple value cache on each App Server. For details, see Triple Cache and Triple Value Cache in the Semantics Developer's Guide. |
| Reindex Refragment Rate | The average rate of the database reindex/refragment process. For more information, see Reindexing a Database in the Administrator's Guide. |
| Rebalance Rate | The average rate of the database rebalancing process. For details, see Database Rebalancing in the Administrator's Guide |
