MarkLogic 9 Product DocumentationOps Director Guide — Chapter 3
Navigating and Filtering Ops Director Views
This chapter describes the general navigation features of Ops Director. The navigation features that are specific to a view are described in its respective chapter.
This chapter covers the following topics:
- Main Navigation Bar
- Navigating Resource Views
- Date and Time Filters
- Navigation Icons of Ops Director Views
- Preserving View States
Main Navigation Bar
In the context of this document, view is a top-level page of Ops Director UI, which you can access from the menu bar. The menu bar appears at the top of every Ops Director view.
MONITOR View is an aggregate view that shows the summary of the state of resources in your enterprise.
MANAGE View shows details for a selected MarkLogic resource or resource category, in the form of charts, tables, and other displays.
ANALYZE View presents a comprehensive set of detailed charts that allow to analyze utilization and performance of system resources, such as disks, CPU, memory, network, databases, and servers.
SUPPORT view shows alerts for application servers in your enterprise, allows you to view and filter server logs, and displays tasks that run on your managed clusters.
CONSOLE SETTINGS View allows you to configure role-based access control to resources, manage user accounts, manage licensing, and define telemetry settings.
![]() Click to view a display of latest system alerts. The Alerts icon is persistent across the application. It displays a count of alerts that require attention. To glance through the new alerts quickly in the internal screens of the application, select the alert icon to display the alerts panel as an overlay. Alerts are filtered by severity (All, Critical, Warning, and Information). Each alert has a menu with a list of relevant actions (Acknowledge, View Logs). Click View Alert Details to view the Support / System Alerts screen.
Click to view a display of latest system alerts. The Alerts icon is persistent across the application. It displays a count of alerts that require attention. To glance through the new alerts quickly in the internal screens of the application, select the alert icon to display the alerts panel as an overlay. Alerts are filtered by severity (All, Critical, Warning, and Information). Each alert has a menu with a list of relevant actions (Acknowledge, View Logs). Click View Alert Details to view the Support / System Alerts screen.
![]() Click the User icon for a display with the name of the user currently logged in and an option to logout of Ops Director. Administrators are advised to log out of Ops Director when not in use to guard against unauthorized agents that could compromise the security of the system.
Click the User icon for a display with the name of the user currently logged in and an option to logout of Ops Director. Administrators are advised to log out of Ops Director when not in use to guard against unauthorized agents that could compromise the security of the system.
In general, clicking on a region of an Ops Director page that represents a resource will enable you to drill down to a more detailed representation of that resource. The context of the detailed representation is determined by the current view. For example, when displaying the Monitor view, clicking Clusters displays a color-coded view of the health of each cluster from which you can select to drill down into more detail on the health metrics for that cluster, such as CPU, memory, and network loads. When displaying the Manage view, clicking Clusters displays a list of clusters from which you can select to drill down into more detail on the metrics for that cluster.
For each Ops Director view, there is a dedicated chapter in this guide that provides detailed description of the view.
Navigating Resource Views
The Manage and ANALYZE views provide you with an ability to modify your view of the resources. The left navigation panel of these views enables navigating across individual resources or groups of resources. The main resource view options are:
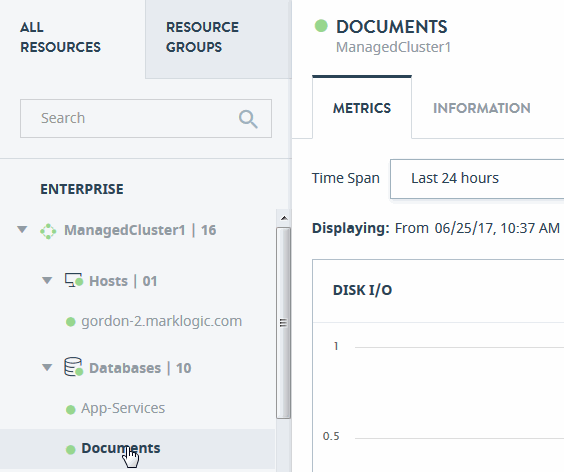
View All Resources
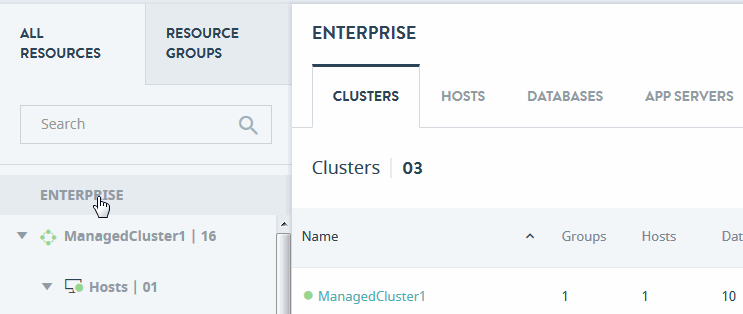
Select All Resources to display a consolidated view of all of the resources in your enterprise. The lists can be expanded and collapsed by clicking on the name. Each Cluster will show Hosts, Databases, and App Servers that belong to that particular cluster.
The health status of resources are shown at both parent and child level. The colors used to represent resource status are described in Terms.
You can drill down to more specific views of a particular cluster or a group of similar resource types in your cluster.
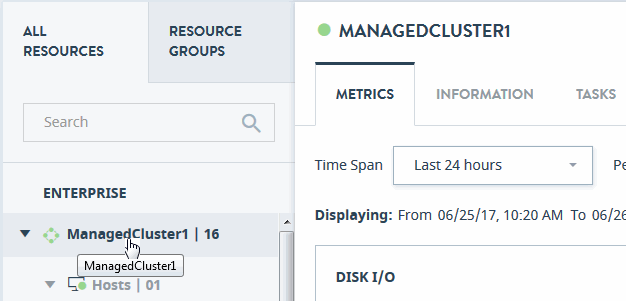
You can also drill down to a specific resource within a resource type, for example a specific database or a specific application server.
View Resource Groups
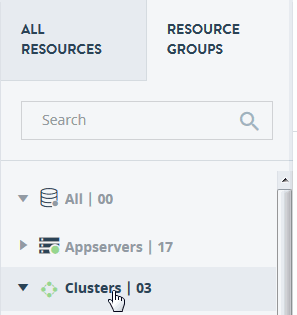
Select the Resource Groups tab to display a consolidated view of all the defined resource groups. If a group contains Clusters, collapsing or expanding each cluster hides or reveals members of the resource group.
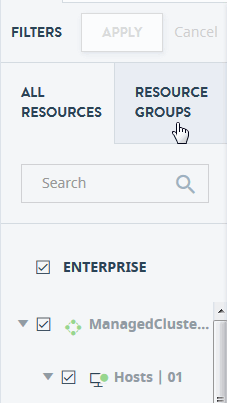
For more information on resource groups, see Resource Groups.
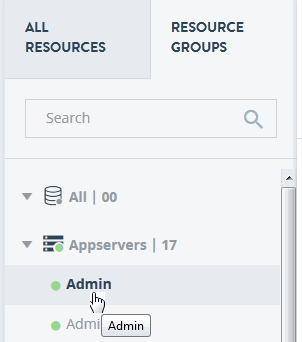
You can drill down to more specific views of a resources in a particular group or a specific resource within a resource group.
Click on an object or resource in the navigation tree to display relevant information in the content area. The selection is highlighted in the navigation tree.
Date and Time Filters
The Analyze and Support views of Ops Director, as well as some tabs of the Manage view, provide a date and time filter that enable you modify your data views.
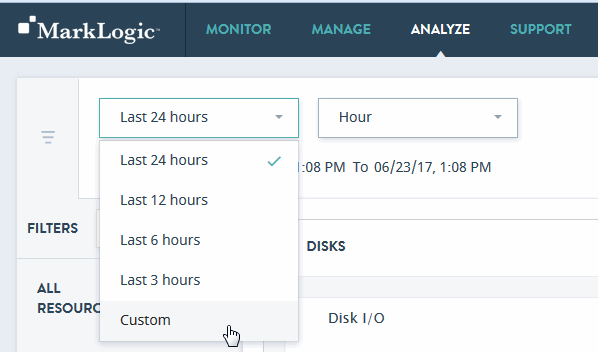
Select from a list of commonly used time periods, or select Custom.
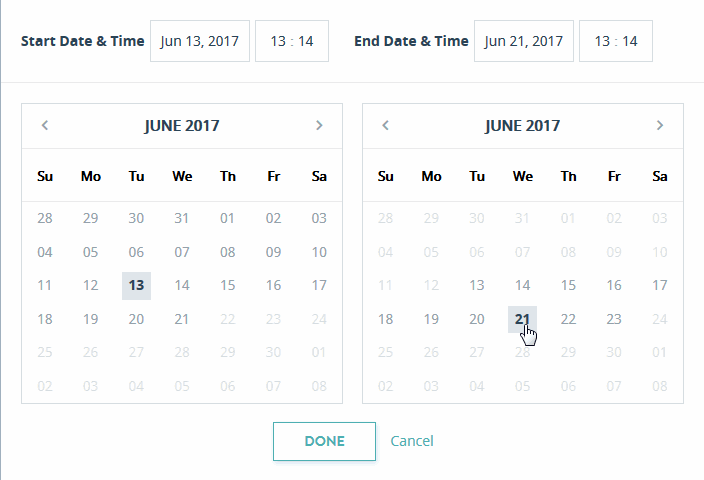
The Custom time filter allows you to choose a specific start and end date and time.
The date and time the graphs were initially and last updated is shown under the time filters.

Select the Refresh icon to refresh the widget with up-to-date information.
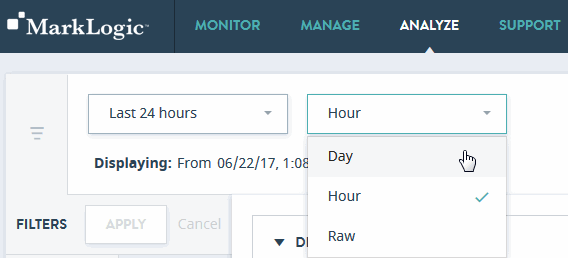
You can use the interval filter to display the data in daily or hourly intervals, or select Raw to display all of the collected data.
The interval filter controls how the data is displayed in Ops Director and will not display less frequently collected data. For example, to set the log interval filter in Ops Director to Raw, you must also set Ops Director Metering to raw in the Admin Interface, as described in Step 9 in Installing Ops Director.
Navigation Icons of Ops Director Views
Each view allows you to navigate and filter the displayed data. Common navigation and filter icons are shown in the following table. Not all views have all of the icons.
| Enter the name of the resource or object to locate in this view. Wildcards are supported. | |
| Click to refresh the view with up-to-date information, based on the current set of filter settings. | |
Click to export data as a CSV (Comma Separated Values) file (Resource Groups, MANAGE View, SUPPORT view). All records that satisfy the set filter parameters are exported with all the columns, regardless of whether they are visible or hidden in the table. |
|
| Click to expand and isolate graph (ANALYZE View). | |
| Click to provide details on this metric (ANALYZE View). | |
| Click to sort the listed results. Default sorting is always enabled on the first column of the table. The up/down arrow is used in the column header to indicate the sorting state. You can click on the same column again to switch between sorting a column in ascending or descending manner. | |
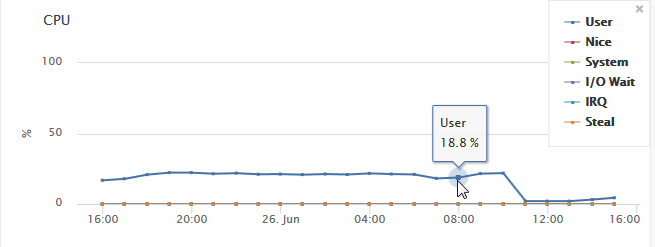
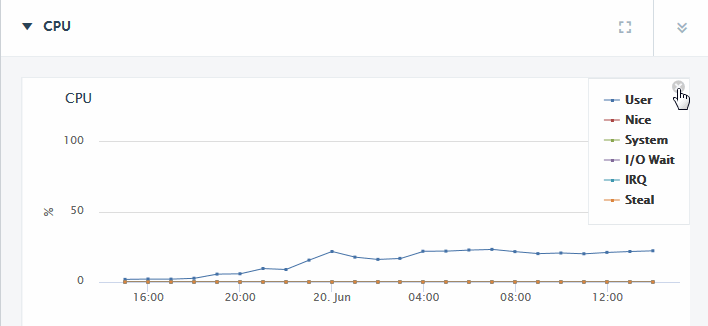
| Click to view the graph legend. Below is an example of the legend for the CPU graph. | |
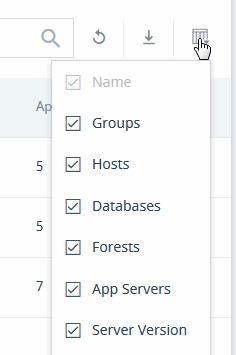
| Click to select which resource rows to display in the table. |
Hover over an item in the legend to highlight the corresponding line in the graph.
Hover on a period point to view what operation was taking place at that point in time.
The following is an example of the resource rows for the Cluster group. Select to display rows in the table.
Preserving View States
Main views of Ops Director preserve their state when you navigate between them. For example, if you select a resource in the Manage view, drill down to a detailed view for that resource, and after that navigate to the ANALYZE view, when you navigate back to the Manage view, you will see the detailed view of that previously selected resource. This allows you to bookmark the state of any view and return to it later.
In particular, the state of the resource navigation panel in the Manage view, including search, filter, and selection, is preserved when leaving and then returning to the view. Also, the state of the ANALYZE view is preserved when leaving and returning to it, which includes filter selections, collapsed or expanded state of the charts, and selected time span.

