MarkLogic Server 11.0 Product DocumentationMonitoring MarkLogic Guide — Chapter 4
Telemetry
The MarkLogic telemetry feature provides faster, more complete communication with MarkLogic Support to facilitate the resolution of issues. If enabled, the telemetry feature collects, encrypts, packages, and sends diagnostic and system-level usage information about MarkLogic clusters with minimal impact on performance. Telemetry sends information about your MarkLogic Servers to a protected and secure location where it can be accessed by MarkLogic Support to facilitate troubleshooting and monitor performance. No application data is collected or sent.
Telemetry data is collected from:
This chapter describes telemetry and includes the following sections:
- Understanding Telemetry
- Configure Telemetry in the Admin UI
- Example--Telemetry
- Configure Telemetry With XQuery
- Baseline System Information
- Upload a Support Request to Support
- Telemetry Usage Feature
- APIs for Telemetry
- Interactions With Other MarkLogic Features
Understanding Telemetry
If telemetry is enabled, MarkLogic Server registers with a well-known endpoint. Data is collected from each host in a cluster: log records from the Error log (ErrorLog.txt which contains system logs), monitoring history and usage data (XML documents from the Meters database), application and host config files from Data/*.xml, (including license key feature and entitlement info) and Telemetry Usage data. See Telemetry Usage Feature for more information. Personally Identifiable Information (PII) and Application data have been physically split from System data (into application-specific log files), and are not collected. Only System data is collected for Telemetry. Telemetry data is sent to secured cloud storage in a protected location. See Viewing Monitoring History for more about monitoring history and the Meters database.
The type and granularity of data sent via telemetry is configurable. You can:
- Enable/disable log data: to collect log data; you can select values for the level of logging from fine through debug to emergency levels
- Enable/disable metering history data: to collect metering history data at the level you choose
- Enable/disable host/cluster configuration data: to collect any changes to configuration files
- Enable/disable usage data: to collect Telemetry usage data
The MarkLogic telemetry feature enables you to send relevant historical data to MarkLogic Support to facilitate troubleshooting and resolution of issues.
Configure Telemetry in the Admin UI
To configure telemetry for your MarkLogic cluster, see the following sections:
Enable Telemetry on the Group Configuration Page
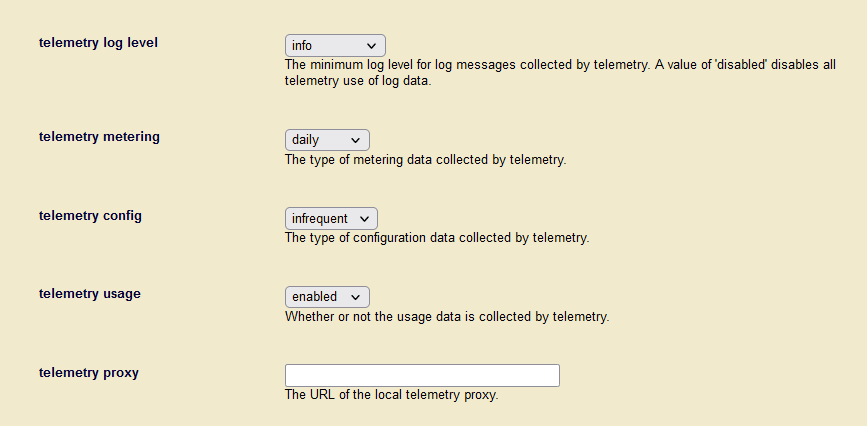
To enable telemetry from the Admin UI, navigate to the Group Configuration page and set the telemetry levels for logs, metering, configuration, and usage changes.
- In the Admin UI, click Groups in the left tree menu.
- On the Group Configuration page, scroll down to the Telemetry options.
Each of these types of telemetry can be configured individually. For example, you can configure telemetry for metering and not configure telemetry for log level or config. Select the type and level of MarkLogic telemetry you want to enable (logging, metering, configuration, or usage information) from the drop-down menu next to the option.
Telemetry log level: Enable and configure the log messages collected by telemetry. Possible values are finest, finer, fine, debug, config, info, notice, warning, error, critical, alert, emergency, or disabled. The default is disabled. A value of disabled disables all telemetry use of log data. We recommend setting log level to debug or config, as these values will allow MarkLogic Support to better assist and troubleshoot tickets.
Telemetry metering: Enable telemetry for metering information. Possible values are raw, daily, hourly, or disabled. The default is disabled. A value of disabled disables all telemetry use of metering data. We recommend a setting of hourly or daily, as these values will allow MarkLogic Support to better assist and troubleshoot tickets.
Telemetry config: Enable telemetry for any configuration changes in the cluster. Possible values are frequent, infrequent, or disabled. The default is disabled. A value of disabled disables all telemetry use of configuration data. We recommend a setting of infrequent, as these values will allow MarkLogic Support to better assist and troubleshoot tickets.
Telemetry Usage: Enable telemetry for usage data. Possible values are enabled and disabled. The default is enabled. If enabled, the usage data is collected per host when the server starts/restarts, and every 7 days since. A value of disabled disables all telemetry use of usage data.
The level set for each telemetry setting affects the amount of data collected and has a small impact on storage and network use. Telemetry may use up to a maximum of 20GB of storage in the Stage directory, though typically the volume will be less than 100MB.
Telemetry proxy: The URL of the local telemetry proxy. The proxy URL should start with
https://, for example,https://proxy.marklogic.com:8080. If you don't specify the port number, it assumes the proxy server is listening on port 8080.
The system baseline data, which is sent regardless of what type of telemetry is enabled, includes the following information: system data (hostid, clusterid, license) and Standard HTTP Headers added by the system and internet routers (IP address, content type, and so on). Data containing Personally Identifiable Information (PII) is not collected.
So, if telemetry metering is enabled, the Usage and Feature Metrics data will be sent. The actual data in the Usage and Feature Metrics files is very small and consists of two types of data - Usage data (collected once an hour), which includes a few core values like OS, Memory size, License Key, and so on, and Feature Metrics (also collected once an hour), which is a set of name-counter pairs for feature usage.
A feature usage example would be measuring to see if the Optic API is being used. This helps MarkLogic understand the adoption of new features and guide us on how to improve the product.
See Log Files in the Administrator's Guide for more about log files and log level descriptions. See Monitoring MarkLogic Server for more about metering information.
Example --Telemetry
This simple example shows how telemetry works by having you configure telemetry and then viewing the information that would be sent, either locally or in a browser.For this example, perform these steps:
- Configure telemetry - see Enable Telemetry on the Group Configuration Page for details.
- Let your system run for 10-15 minutes to generate data and then change the log level or make another configuration change to your system.
- To view the output, you can see the staged messages being collected to be uploaded in
/var/opt/MarkLogic/Stage(Config, Logs, Meters, Usage). See View Staged Telemetry Files.Checking the locally staged files will not work if you have encryption at rest enabled. Encryption settings apply to all staged files, if enabled See Encryption at Rest in the Security Guide for more information.
View Staged Telemetry Files
To see the files being staged locally for telemetry, navigate to /var/opt/MarkLogic/Stage/Logs.
Type tail -f ErrorLog.txt |grep -i telemetry and press return. When telemetry is enabled this will show a running log of the data being that is being collected and uploaded every 5 minutes.
This example shows when data that has been sent to telemetry:
[localhost Logs]$ tail -f ErrorLog.txt |grep -i telemetry
2021-08-25 16:36:47.001 Info: Uploaded 47 records, 1 MB of Config Files to Telemetry
2021-08-25 16:36:47.972 Info: Uploaded 4 records, 1 MB of Meters Data to Telemetry
2021-08-25 16:36:48.794 Info: Uploaded 64 records, 1 MB of Error Logs to Telemetry
2021-08-25 16:37:03.169 Info: Uploaded 1 records, 1 MB of Usage Data to Telemetry
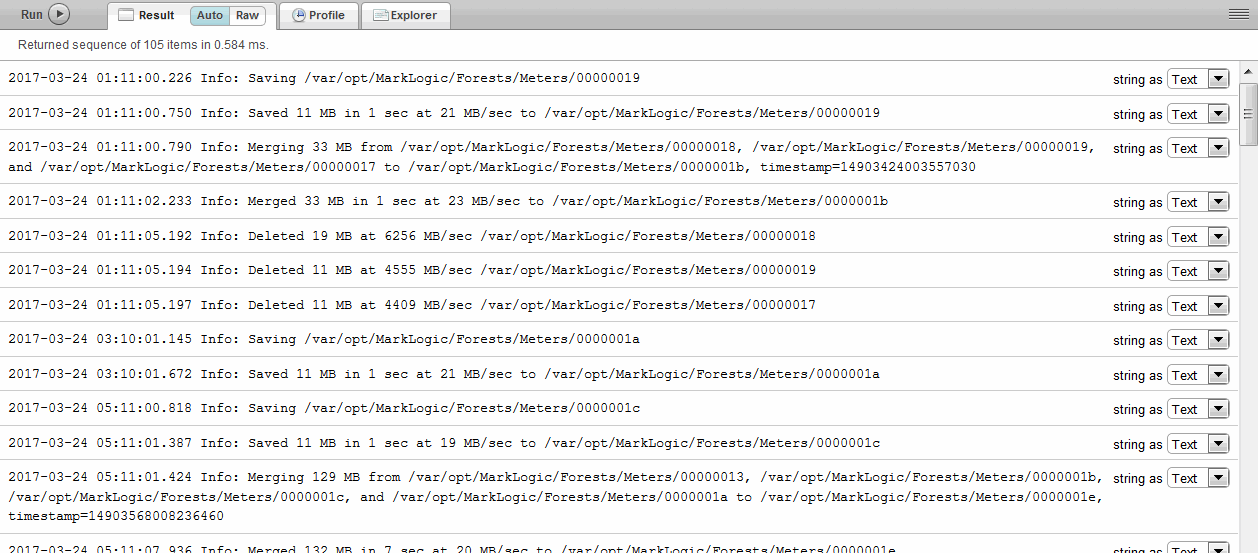
You can also view the data that is being collected in the log files using Query Console. Type the following into the Query Console:
xdmp:logfile-scan("/var/opt/MarkLogic/Logs/ErrorLog.txt")
The output will look similar to the following:
Checking the locally staged log files will not work if you have encryption at rest enabled for log files. See Configuration File and Log File Encryption Options in the Security Guide for more information.
To see the log data being collected for telemetry (which may different from the file log ErrorLog.txt data due to different log file settings), use this query:
xdmp:logfile-scan("/var/opt/MarkLogic/Stage/Logs/ErrorLog.txt")
Encryption of Staged Files
If you have enabled encryption at rest for your log files and/or configuration files, these files will be encrypted while they are staged, prior to being uploaded. The staged files can be found in /var/opt/MarkLogic/Stage. The encryption process is transparent to the user. See Encryption at Rest in the Security Guide for more information about file encryption.
Telemetry on the Support Page
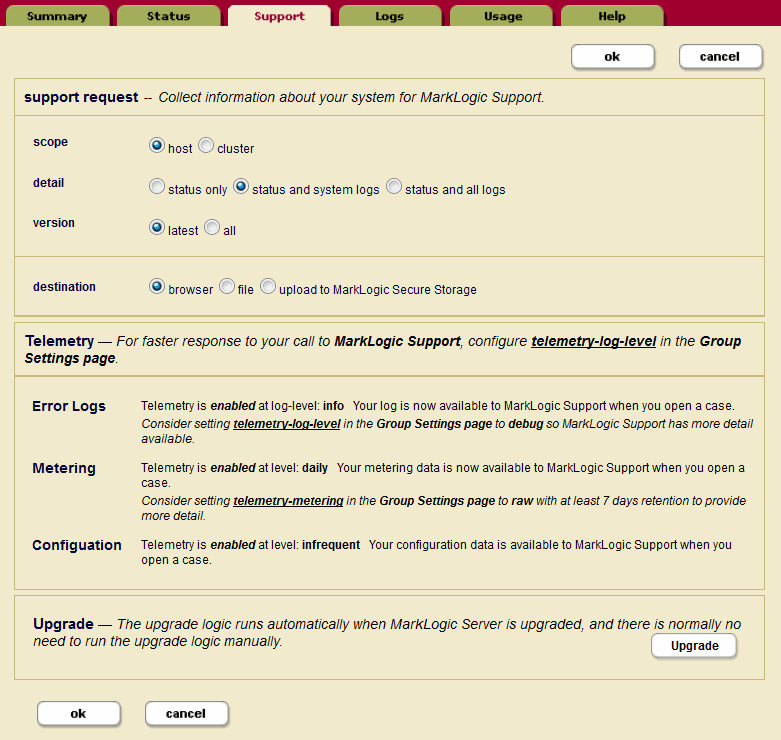
To verify the MarkLogic telemetry data being collected or see a sample of what is being sent, check the Telemetry section on the Support page. To navigate to the Support page in the Admin UI, click the Support tab.
The top part of this page is used to create Support Request information, and is independent of Telemetry data files, which are sent continuously once enabled. The Support Request data is a snapshot of the system information that can be sent to MarkLogic secure storage on demand.
In the Telemetry section, you can verify the information that telemetry has collected to send on a scheduled basis, and check the current telemetry status for the different types of data. To change the configuration, click the hyperlink next to each telemetry option. You can also:
- Enable or disable collection of different types of telemetry on the Group Settings page by clicking the link next to each type.
- Check the levels for the types of data to collect for telemetry: log messages, metering data, and configuration information. You can set these on the Group Settings page. See Enable Telemetry on the Group Configuration Page for details.
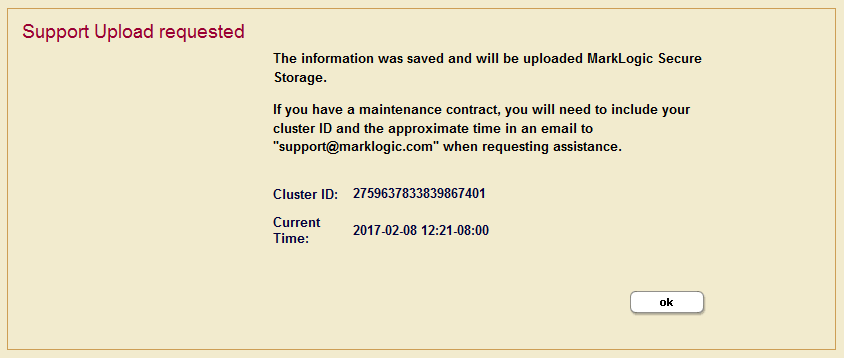
After you have configured your telemetry settings on the Group Setting page, the information will be displayed on this page, and collected and sent automatically in the background. You can manually upload support request data to MarkLogic Support by selecting the radio button next to upload to MarkLogic Secure Storage and clicking the ok button. The Support Request confirmation screen will be displayed when the upload is complete.
The confirmation includes the cluster ID for the Support Request information and a timestamp. Include this information in your email to MarkLogic Support. Support will also need to know the time of the incident or when the issue was first noticed. See Upload a Support Request to Support for more information.
Telemetry data is collected only after you enable the telemetry settings. We recommend that you enable telemetry as a normal practice, so that you have the system information available as part of a Support request should you have an issue.
Configure Telemetry With XQuery
You can also configure telemetry using the Telemetry APIs. See APIs for Telemetry for the complete list. Here are a few examples of configuring telemetry using XQuery. You can run these examples in the Query Console. To set the telemetry log level with XQuery:
xquery version "1.0-ml";
import module namespace admin = "http://marklogic.com/xdmp/admin"
  at "/MarkLogic/admin.xqy";

let $config := admin:get-configuration()
let $groupid := admin:group-get-id($config, "Default")
let $value := "finest"
let $tlogconfig := admin:group-set-telemetry-log-level($config, $groupid, $value)
return
admin:save-configuration($tlogconfig)
To check the telemetry log configuration, use this query:
xquery version "1.0-ml";
import module namespace admin = "http://marklogic.com/xdmp/admin"
  at "/MarkLogic/admin.xqy";

let $config := admin:get-configuration()
let $groupid := admin:group-get-id($config, "Default")
return
admin:group-get-telemetry-log-level($config, $groupid)
=>
finest
To see the type of metering data that is being collected by telemetry, you can use the admin:group-get-telemetry-metering function.
xquery version "1.0-ml";
import module namespace admin = "http://marklogic.com/xdmp/admin"
  at "/MarkLogic/admin.xqy";

let $config := admin:get-configuration()
return
admin:group-get-telemetry-metering($config,
  admin:group-get-id($config, "Default"))
=>
daily
To see whether telemetry usage data is being collected by telemetry, you can use the admin:group-get-telemetry-usage function.
xquery version "1.0-ml";
import module namespace admin = "http://marklogic.com/xdmp/admin"
at "/MarkLogic/admin.xqy";
let $config := admin:get-configuration()
let $groupid := admin:group-get-id($config, "Default")
return admin:group-get-telemetry-usage($config, $groupid)
=>
enabled
To see the type of proxy server URL that is being used by telemetry, you can use the admin:group-get-telemetry-proxy function.
xquery version "1.0-ml";
import module namespace admin = "http://marklogic.com/xdmp/admin"
  at "/MarkLogic/admin.xqy";

let $config := admin:get-configuration()
return
admin:group-get-telemetry-proxy($config,
  admin:group-get-id($config, "Default"))
=>
"https://proxy.marklogic.com:8080"
Baseline System Information
Baseline system information is sent whenever telemetry is on. The system baseline data, which is sent regardless of what type of telemetry is enabled, includes the following information: system data (hostid, clusterid, license) and Standard HTTP headers added by the system and internet routers (IP address, content type, and so on). Data containing Personally Identifiable Information (PII) is not collected.
If telemetry metering is enabled, metering data will be collected as part of the baseline information that is sent.
Metering Data
To view the metering data that is being collected as part of the baseline system information, you can use the Query Console. To see the data do the following:
- In the Query Console, select the Meters database.
- Click the Explore button.
- You will see files ending in -raw.xml, -hourly.xml, and -day.xml. Filenames ending in -raw.xml are collected every minute, if telemetry is enabled. Filenames ending in -hour.xml are collected hourly, and those ending in -day.xml are collected daily. There may also be files ending in features.xml.
Note the size of the data that is returned.
Hourly and Daily metering is very small, while raw data is much larger.
Upload a Support Request to Support
When you contact Support (https://help.marklogic.com/) you may be asked to create a Support Request (Support Dump) for your MarkLogic installation to help diagnose and solve the issue. The Support Request can be configured to send information about the host, or the whole cluster. You can select the level of detail to provide and which version (current or all) of the status and/or system logs to send. The Support Request is a snapshot of a point in time in your MarkLogic environment, and includes status information, log files, configuration files, and other information. Depending on what options you select, the Support Request will collect the latest, or all versions of the selected options (status, logs, config files). See Telemetry on the Support Page for option details. These files are read from disk and can be reviewed by opening the data directory located at /var/opt/MarkLogic or C:\Program Files\MarkLogic\Data.
Telemetry data files, in addition to the Support Request data mentioned in the previous paragraph, will help MarkLogic Support determine root causes for issues. Telemetry, if enabled, sends a packet of current information on a scheduled basis about a MarkLogic cluster (node) to the secured cloud storage. MarkLogic Support can then retrieve historic information about the MarkLogic environment from the day telemetry was enabled. This helps Support to identify at what point in time the reported issue started and determine the possible root cause. The Support Request snapshot and telemetry stream are independent of one another. However, since telemetry data captures information about your system as snapshots of current data on a regular basis, enabling telemetry early before issues arise, is the key to leveraging this feature.
When providing information for a Support request, only provide required information to MarkLogic Support and which is cleared of confidential or other sensitive information. MarkLogic does not require Protected Health Information (PHI), Payment Card Industry (PCI) information, or Personally Identifiable Information (PII) to provide Support Services. Therefore, do not forward any of such types of information to MarkLogic in connection with a Support request. At all times, information provided to MarkLogic in the course of Support will be handled in accordance with the Privacy Policy available here: http://www.marklogic.com/privacy-policy/. Similarly, any information collected via telemetric functionality enabled by users of MarkLogic Server will be handled in accordance with the above-referenced Privacy Policy.
To create and upload a Support Request, navigate to the Support tab. When selecting the Support information, click the upload to MarkLogic Secure Storage radio button. The contents will be uploaded to a secure server where MarkLogic Support can access the information.
You will also be asked to send an email to Support with your cluster ID and the approximate time and date of the Support Request. This information is available to you as part of the Support Request confirmation screen. Support will also need to know the time the incident first occurred or first was noticed. See Telemetry on the Support Page for an example of the Support Request Saved confirmation screen, which includes the cluster ID, along with time and date information. You can also find the cluster ID through the Admin UI by clicking on Clusters on the left tree menu. The cluster ID is listed on the Cluster Summary View page.
Telemetry Usage Feature
In MarkLogic 10.0-8, the Telemetry Usage Feature is added. It collects and sends usage data to the secured cloud storage from MarkLogic clusters. Telemetry Usage is enabled by default. The upload of the usage data is scheduled every time after the server starts/restarts, and every 7 days since. This feature does not collect any PII info. Telemetry usage data provides essential information for MarkLogic Global Customer Success team to better provide guidance and suggestions for customers, and ensure business compliance. This feature can be switched off through Admin UI, Admin APIs, and REST APIs.
Example of usage data collected by Telemetry:
<usage-files xmlns="http://marklogic.com/xdmp/telemetry">
  <telemetry-usage xmlns="http://marklogic.com/xdmp/telemetry-usage">
   <current-time>2021-08-25T17:32:21.099407-07:00</current-time>
   <license-key/>
   <cluster-id>6970588360785956700</cluster-id>
   <host-id>18163410317407796614</host-id>
   <group-id>6124767890639452752</group-id>
   <group-name>Default</group-name>
   <cpus>2</cpus>
   <cores>12</cores>
   <core-threads>24</core-threads>
   <architecture>x86_64</architecture>
   <platform>linux</platform>
   <edition>Essential Enterprise</edition>
   <version>10.0-8</version>
   <software-version>10000800</software-version>
   <effective-version>10000800</effective-version>
   <os-version>Linux 4.18.19-100.fc27.x86_64 (Fedora release 27 (Twenty Seven))</os-version>
   <host-size>3</host-size>
   <host-large-data-size>0</host-large-data-size>
   <memory-size>65536</memory-size>
  </telemetry-usage>
</usage-files>
APIs for Telemetry
These functions are available for managing telemetry functionality, both Admin APIs and REST Management APIs.
Admin APIs
- admin:group-set-telemetry-log-level
- admin:group-get-telemetry-log-level
- admin:group-set-telemetry-config
- admin:group-get-telemetry-config
- admin:group-set-telemetry-metering
- admin:group-set-telemetry-usage
- admin:group-get-telemetry-usage
- admin:group-get-telemetry-metering
- admin:group-set-telemetry-proxy
- admin:group-get-telemetry-proxy
- admin:group-set-telemetry-session-endpoint
- admin:group-get-telemetry-session-endpoint
REST Management APIs for Telemetry
You can use the REST API for Telemetry management. The REST Management APIs provide the same functionality as the XQuery APIs covered in Admin APIs. The security endpoint is used to by the REST Management APIs to manage telemetry.
GET /manage/v2/groups[id|name]/properties
Interactions With Other MarkLogic Features
The following section describes possible feature interactions between telemetry and other MarkLogic features.
Encryption at Rest
Telemetry follows the encryption settings for the group for all temporary data that is stored on disk as configured for:
See Encryption of Staged Files for more details about the encryption of telemetry data. For more information about encryption, see Encryption at Rest in the Security Guide.
Rolling Upgrades
During a rolling upgrade, before the cluster has been committed to the new version of MarkLogic (9.0-1 or later), any node that has been upgraded to the newer version, will be in read-only mode until the upgrade is committed. This is so that no configuration file changes can be made in a mixed cluster (for example 8.0-7 ->9.0-1) before the upgrade is completed.
Support Uploads
Telemetry settings do not interfere with manually initiated uploads of Support Requests using the Support tab in the Admin UI. These uploads will work whether or not telemetry is enabled.


