MarkLogic Server 11.0 Product DocumentationMonitoring MarkLogic Guide — Chapter 3
MarkLogic Server Monitoring History
This chapter describes how to use the Admin Interface and Monitoring History dashboard to capture and make use of historical performance data for a MarkLogic cluster. These same Monitoring History operations can also be done using the XQuery and REST APIs, as described in XQuery and XSLT Reference Guide and the MarkLogic REST API Reference.
All MB and GB metrics described in this chapter are base-2.
The main topics in the chapter are:
- Overview
- Enabling Monitoring History on a Group
- Setting the Monitoring History Data Retention Policy
- Viewing Monitoring History
- Viewing Monitoring History by Time Span and Frequency
- Labeling Monitoring History Time Spans
- Filtering Monitoring History by Resources
- Historical Performance Charts by Resource
- Exporting and Printing Monitoring History
Overview
The Monitoring History feature allows you to capture and view critical performance data from your cluster. Once the performance data has been collected, you can view the data in the Monitoring History pages. The top-level Monitoring History page provides an overview of the performance metrics for all of the key resources in your cluster. For each resource, you can drill down for more detail. You can also adjust the time span of the viewed data and apply filters to view the data for select resources to compare and spot exceptions.
By default, the performance data is stored in the Meters database. Monitoring history capture is enabled at the group level. Typically you have one group per cluster. You can also configure a consolidated Meters database that captures performance metrics from multiple groups. The group configuration defines which database is used to store performance metrics for that group (defaulting to a shared Meters database per cluster), as well as all configuration parameters for performance metrics, such as the frequency of data capture and how long to retain the performance data. The Meters database can participate in all normal database replication, security, and failover operations.
Enabling Monitoring History on a Group
To collect monitoring history data for your cluster, you must enable performance metering for your group.
- Log into the Admin Interface.
- Click the Groups icon on the left tree menu.
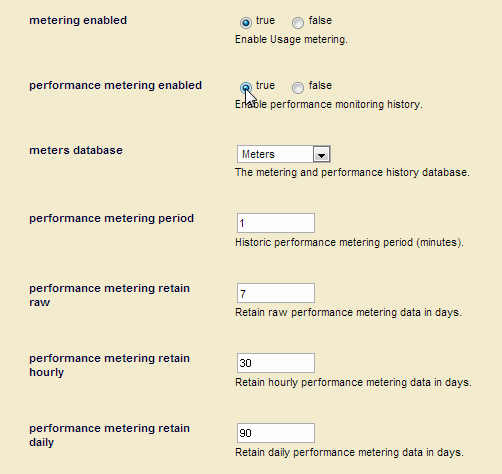
- Locate the Performance Metering Enabled field toward the bottom of the Group Configure page and click on
true.You can configure the parameters for collecting monitoring history data, as described in the following table.
Parameter Description meters database The database in which performance monitoring history data and usage metrics documents are stored. By default, historical performance and usage metrics are stored in the Meters database. performance metering period The performance metering period, in minutes. Performance data is collected at each period. The period can be any value of 1 minute or more. If you are collecting monitoring history for multiple groups, you should either set the same period for each group or configure your filter to view the history data for one group at a time.
performance metering retain raw The number of days raw performance monitoring history data is retained. See Setting the Monitoring History Data Retention Policy for details. performance metering retain hourly The number of days hourly performance monitoring history data is retained. See Setting the Monitoring History Data Retention Policy for details. performance metering retain daily The number of days daily performance monitoring history data is retained. See Setting the Monitoring History Data Retention Policy for details.
Setting the Monitoring History Data Retention Policy
The retention policy (for raw, hourly, daily) is a value set in days. If performance metering is enabled, then all data that is older than that many days for the specified period (raw, hour, day) is deleted. The retention policy is set at a group level, so different groups can have different retention policies. For example, GroupA may have raw set to 1 day and GroupB may have raw set to 10 days. The cleanup code follows this retention value on a per-group basis.
There are cases where metering data may become orphaned, so it may no longer belong to an existing group. Some examples of when this could occur are:
Any metering data that no longer belongs to any active group in the current cluster is deleted. To avoid this, turn off metering or avoid deleting groups and instead move hosts out of the group but keep the group in the cluster configuration.
Loading older monitoring history data (for example, by restoring a backup of the Meters database) will be immediately affected by data retention policy. So, you should turn off performance metering prior to restoring any data that is older than the time specified by your retention policy.
Deletion of data older then the retention policy occurs no sooner than the retention policy, but may, for various reasons, still be maintained for an unspecified amount of time.
Changing the retention policy from smaller to larger values does not restore data that has already been deleted.
The default data retention policy settings are as shown in the following table. To maximize efficiency, it is a best practice to retain raw data for the least number of days and the daily data for the most number of days.
| Period | Retention Period |
|---|---|
| Raw | 7 Days |
| Hourly | 30 Days |
| Daily | 90 Days |
Viewing Monitoring History
You can display the Monitoring History dashboard by doing the following:
- Open a browser and enter the URL:
http://monitor-host:8002/
where monitor-host is a host in the cluster you want to monitor
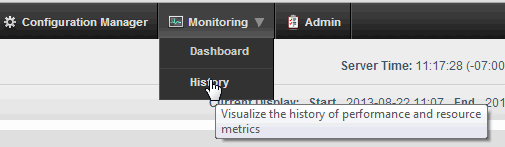
- At the top of the page, click on Monitoring and click on History in the pull-down menu:
- The Monitoring History page appears. From the Monitoring History Overview page, you can navigate to any of the pages described in this chapter.
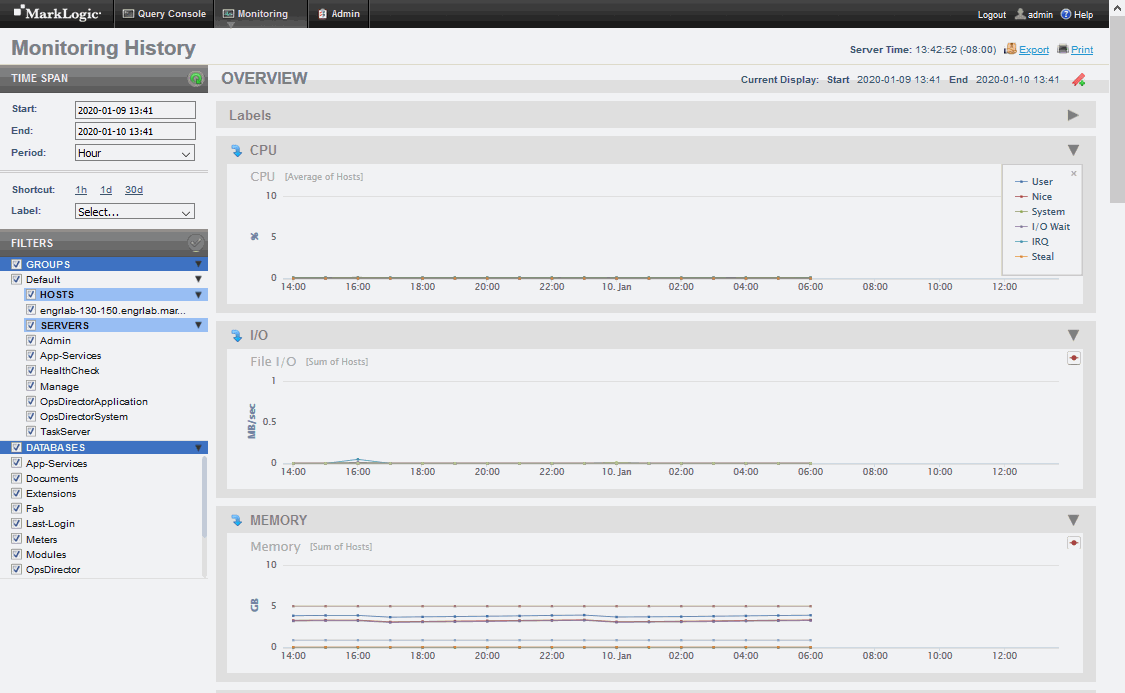
Each line in a chart represents a metric for the resource. In the Overview page, the lines represent an aggregate of the metrics for all of the cluster resources. In each page below Labels, the lines represent the metric for each specific resource.
Chart titles on the Overview page include bracketed information specifying how chart data gathered across multiple resources is aggregated. For example, [Average of Hosts] means that the data retrieved from one or more hosts is averaged for display as points on the chart.
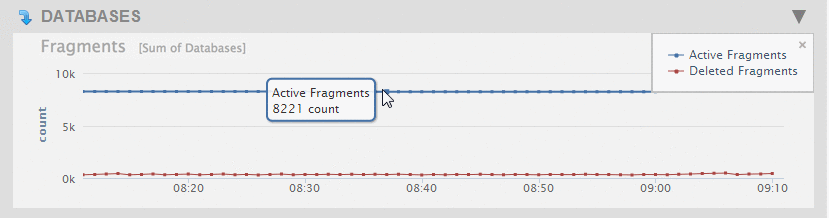
Each point on a line represents a period in which the performance data was captured. Hovering over a chart point displays the name of the resource metric, along with the performance value for the metric at that point in time.
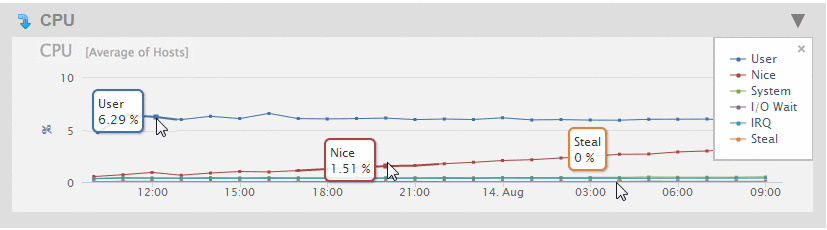
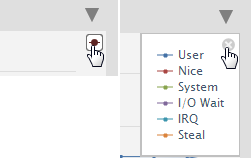
The displayed metrics (in MegaBytes per second) are color coded. You can display a legend that indicates which colors represent which metrics by clicking on the red dot in the upper right-hand section of the graph. To close the legend, click on the 'x' in the upper right-hand portion of the legend window.
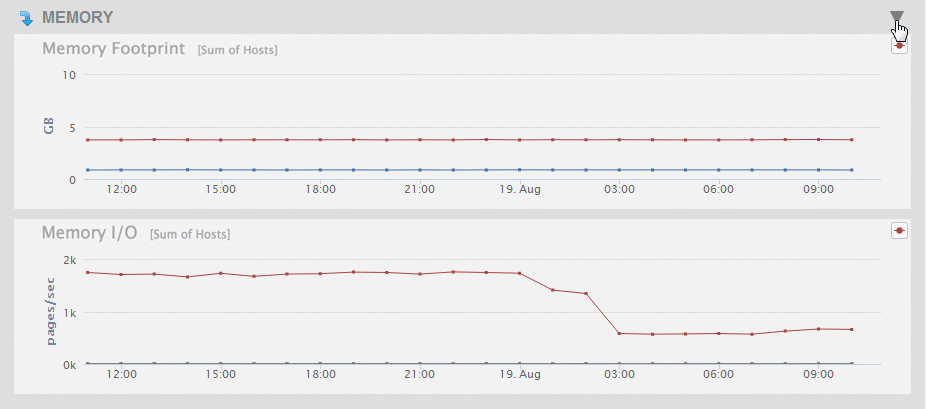
To simplify the view of charts on a page, you can collapse a chart or a group of charts for a resource by clicking on the triangle in the upper right-hard portion of the chart or chart group.
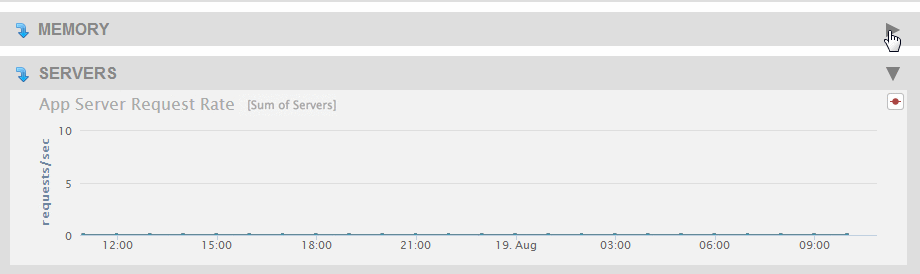
To expand a collapsed chart view, click on the triangle in the upper right-hard portion of the collapsed chart.
Viewing Monitoring History by Time Span and Frequency
As described in Enabling Monitoring History on a Group, the frequency in which performance metrics are captured is configurable, in minute intervals. The snapshots of performance metrics for each host are rolled up into a summary document that contains aggregate calculations on the values for that host.
You can configure your view of the captured performance data by time span and frequency.
The Time Span settings are located in the upper left corner of the Monitoring History page.
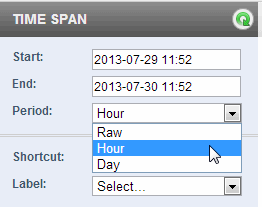
There are three basic settings you can adjust to control how the data is displayed:
- A date/time range, down to the granularity of a minute, that determines the time span of the displayed data. (By default, this is the last 24 hours.)
- A period interval that determines the frequency of the displayed data. The possible intervals are shown in the following table.
To zoom in to display part of the timespan, select the begin time of your zoom on any chart and drag your left mouse button to the end zoom time. The selected timeframe is highlighted and the zoomed-in time is displayed for all of the charts in the page. Navigating to another Monitoring History page resets all of the charts to the timespan selected in the TIME SPAN panel.
After changing either the time span or the period, click refresh to display the updated charts. Clicking refresh will also update any changes you have made to the Filters settings. For details about filters, see Filtering Monitoring History by Resources. If you have zoomed into a portion of a timespan, refresh will redisplay the charts using the timespan selected in the TIME SPAN panel.
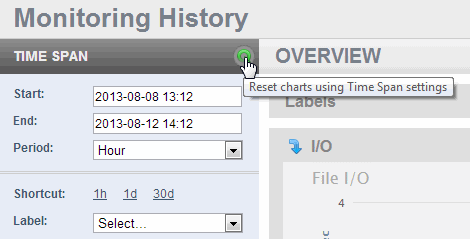
You can use the Shortcut links to display either the last hour, day or 30 days of performance data. Selecting a Shortcut link will automatically refresh the displayed charts.
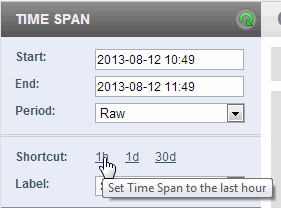
Each Shortcut also sets the Period value, as shown in the following table.
| Shortcut | Period |
|---|---|
| 1h | Raw |
| 1d | Hour |
| 30d | Day |
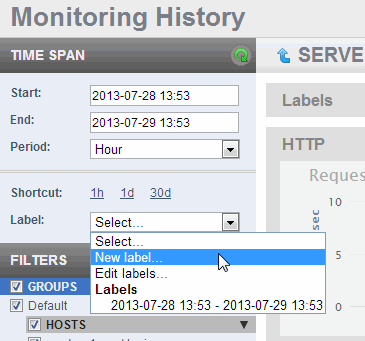
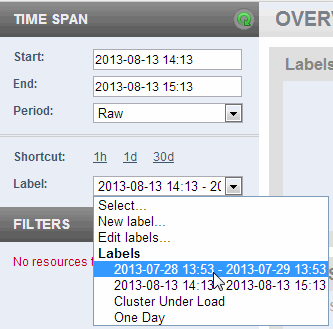
Labeling Monitoring History Time Spans
You can use the Label feature to capture and tag metrics for the set time span. You can store any number of labels. These labels can be used to identify events, instances, and periods of time. Labels can be added, updated or deleted at any time. Labels themselves are not stored with the raw metric data. They are only used for reporting purposes.
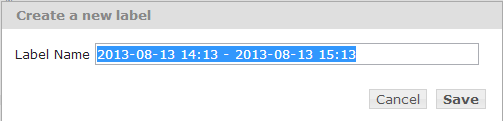
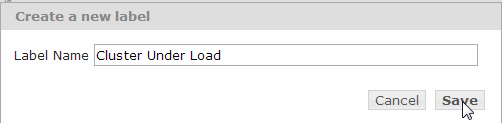
- To create a label for your current view of the Monitoring History, select New Label from the Label pull-down menu.
- In the Create a New Label popup window, the name of the label is the time span of the currently displayed charts, by default.
- You can keep the default name for the label, or change it to be more descriptive. Click Save.
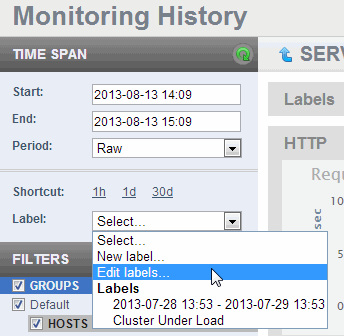
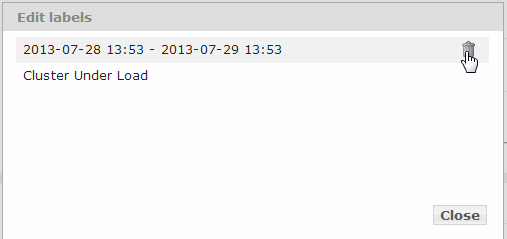
- You can edit your label names or delete labels by selecting Edit Labels from the Labels pull-down menu.
- In the Edit Labels popup window, you can either edit the label name or delete the label. To delete a label, hover over the label and a click on the garbage can icon to the right. When finished editing, click Close.
If you edit a label and, before closing the Edit Labels window, decide not to save your edits, press the Esc key to terminate the edits and keep the original labels.
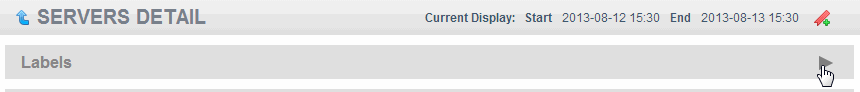
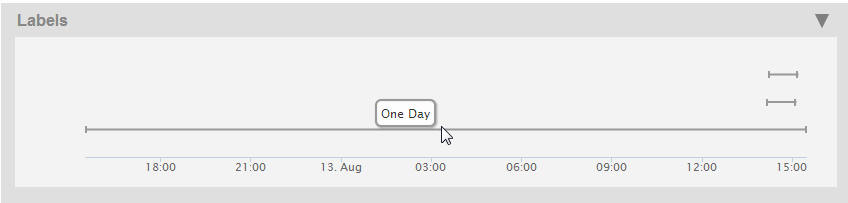
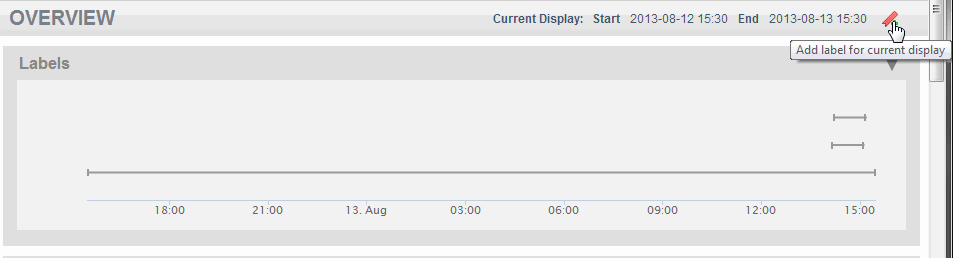
- You can view all of the labels that have data within the currently selected timespan by clicking on the triangle to the right of the Labels section at the top of the Monitoring History page to expand the Labels chart.
- Each label appears as a timeline. Hover over a timeline to display the label name. Click on a timeline to update the view to the time span associated with the label. Selecting a timeline is functionally equivalent to selecting a label from the Label menu in that it updates the view with the start and end times in the TIME SPAN panel.
If your labeled data has been purged from the Meters database, as the result of the retention policy or some other reason, the label will remain but there will be no data associated with that label.
- You can click on the label icon at the top right-hand portion of the page to create a label for the currently displayed time span. Follow the same procedure as described in steps 2 and 3 to finish creating the label.
If the data for a label does not fall within the currently displayed timespan, the label will not be displayed in the Labels chart. To display the charts for such labels, select the label from the Label pull-down menu.
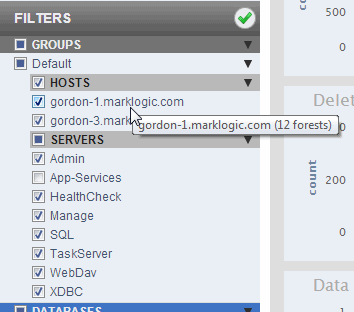
Filtering Monitoring History by Resources
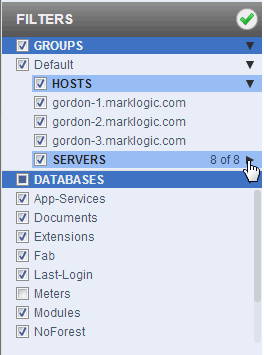
You can set filters for select resources to display only the stored performance metrics for those resources. You can filter by groups and databases. And in each group, by hosts and servers. By default, the metrics for all of the resources in the cluster are displayed.
Filter types that are active for the current view have headings highlighted in blue. For example, on the Overview page, all filters are active while on the Databases Detail view, only database resources are active.
In the filters panel, you can check or uncheck a resource to display or not display the performance metrics for that resource.
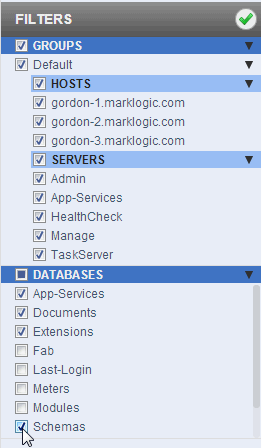
To focus on the resources of interest, you can collapse a category by clicking on the triangle in the right-hand section of the panel. The number of resources for the collapsed category are displayed.
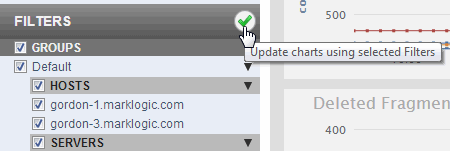
Clicking the checkmark updates the charts with the current filter settings. It does not apply any changes that may have been made to the above TIME SPAN settings.
You can mouse over the resource names in the filter list to get extra information about the resources. For example, mousing over a host name shows the number of forests associated with the host and mousing over a server name shows the server type.
Historical Performance Charts by Resource
From the Monitoring History dashboard, you can view Overview and Detailed performance metrics in graph form for each resource in the cluster. In the Overview page, the lines on a graph represent an aggregate of the metrics for all of the cluster resources of that type. In each Details page, the lines represent the metric for each specific resource in the cluster.
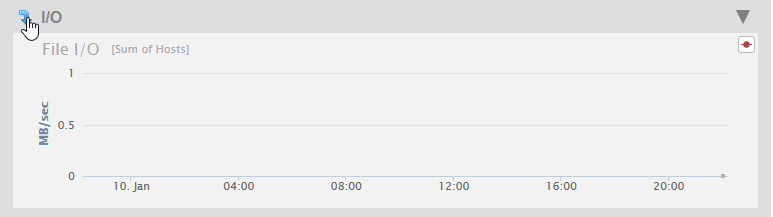
To view the Detail page for a resource, click on the down arrow at the upper left-hand section of the resource graph on the Overview page.
To return to the Overview page from a Detail page, click on the up arrow at the upper left-hand section of the resource graph on the Detail page.
This section describes the Overview and Detail pages for the following resources:
- CPU Performance Data
- I/O Performance Data
- Memory Performance Data
- XDQP Server Requests Performance Data
- Server Performance Data
- Network Performance Data
- Database Performance Data
CPU Performance Data
The Overview page displays a graph of the aggregate performance data for the CPUs used by the hosts selected in the filter.
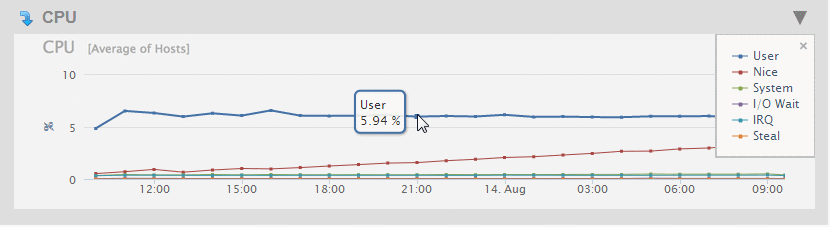
As described in Viewing Monitoring History, you can hover on a period point to view what CPU operation was taking place at that point in time. Each performance metric in the CPU Overview chart is described in the following table.
Click on the arrow in the upper left-hand section of the CPU graph in the Overview page to view graphs that present more detailed CPU performance metrics. The charts on the CPU DETAIL page are described in the following table.
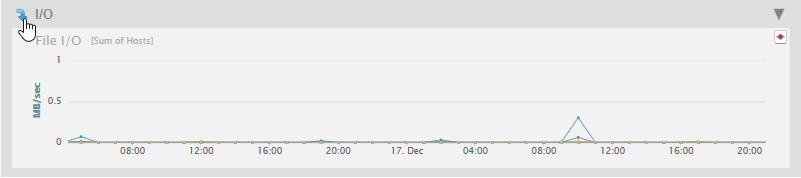
I/O Performance Data
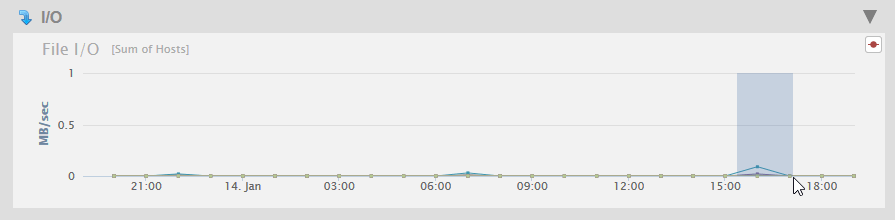
The Overview page displays a graph of the aggregate I/O performance data for the files used by the hosts selected in the filter.
As described in Viewing Monitoring History, you can hover on a period point to view what file operation was taking place at that point in time. Each performance metric is described in the following table.
Click on the arrow in the upper left-hand section of the I/O graph in the Overview page to view charts that present more detailed disk performance metrics.
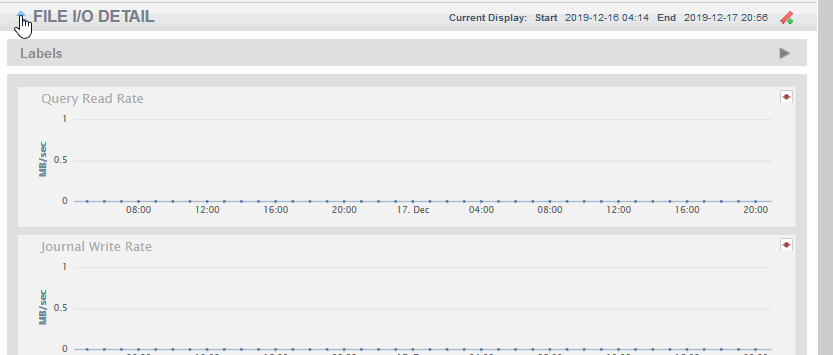
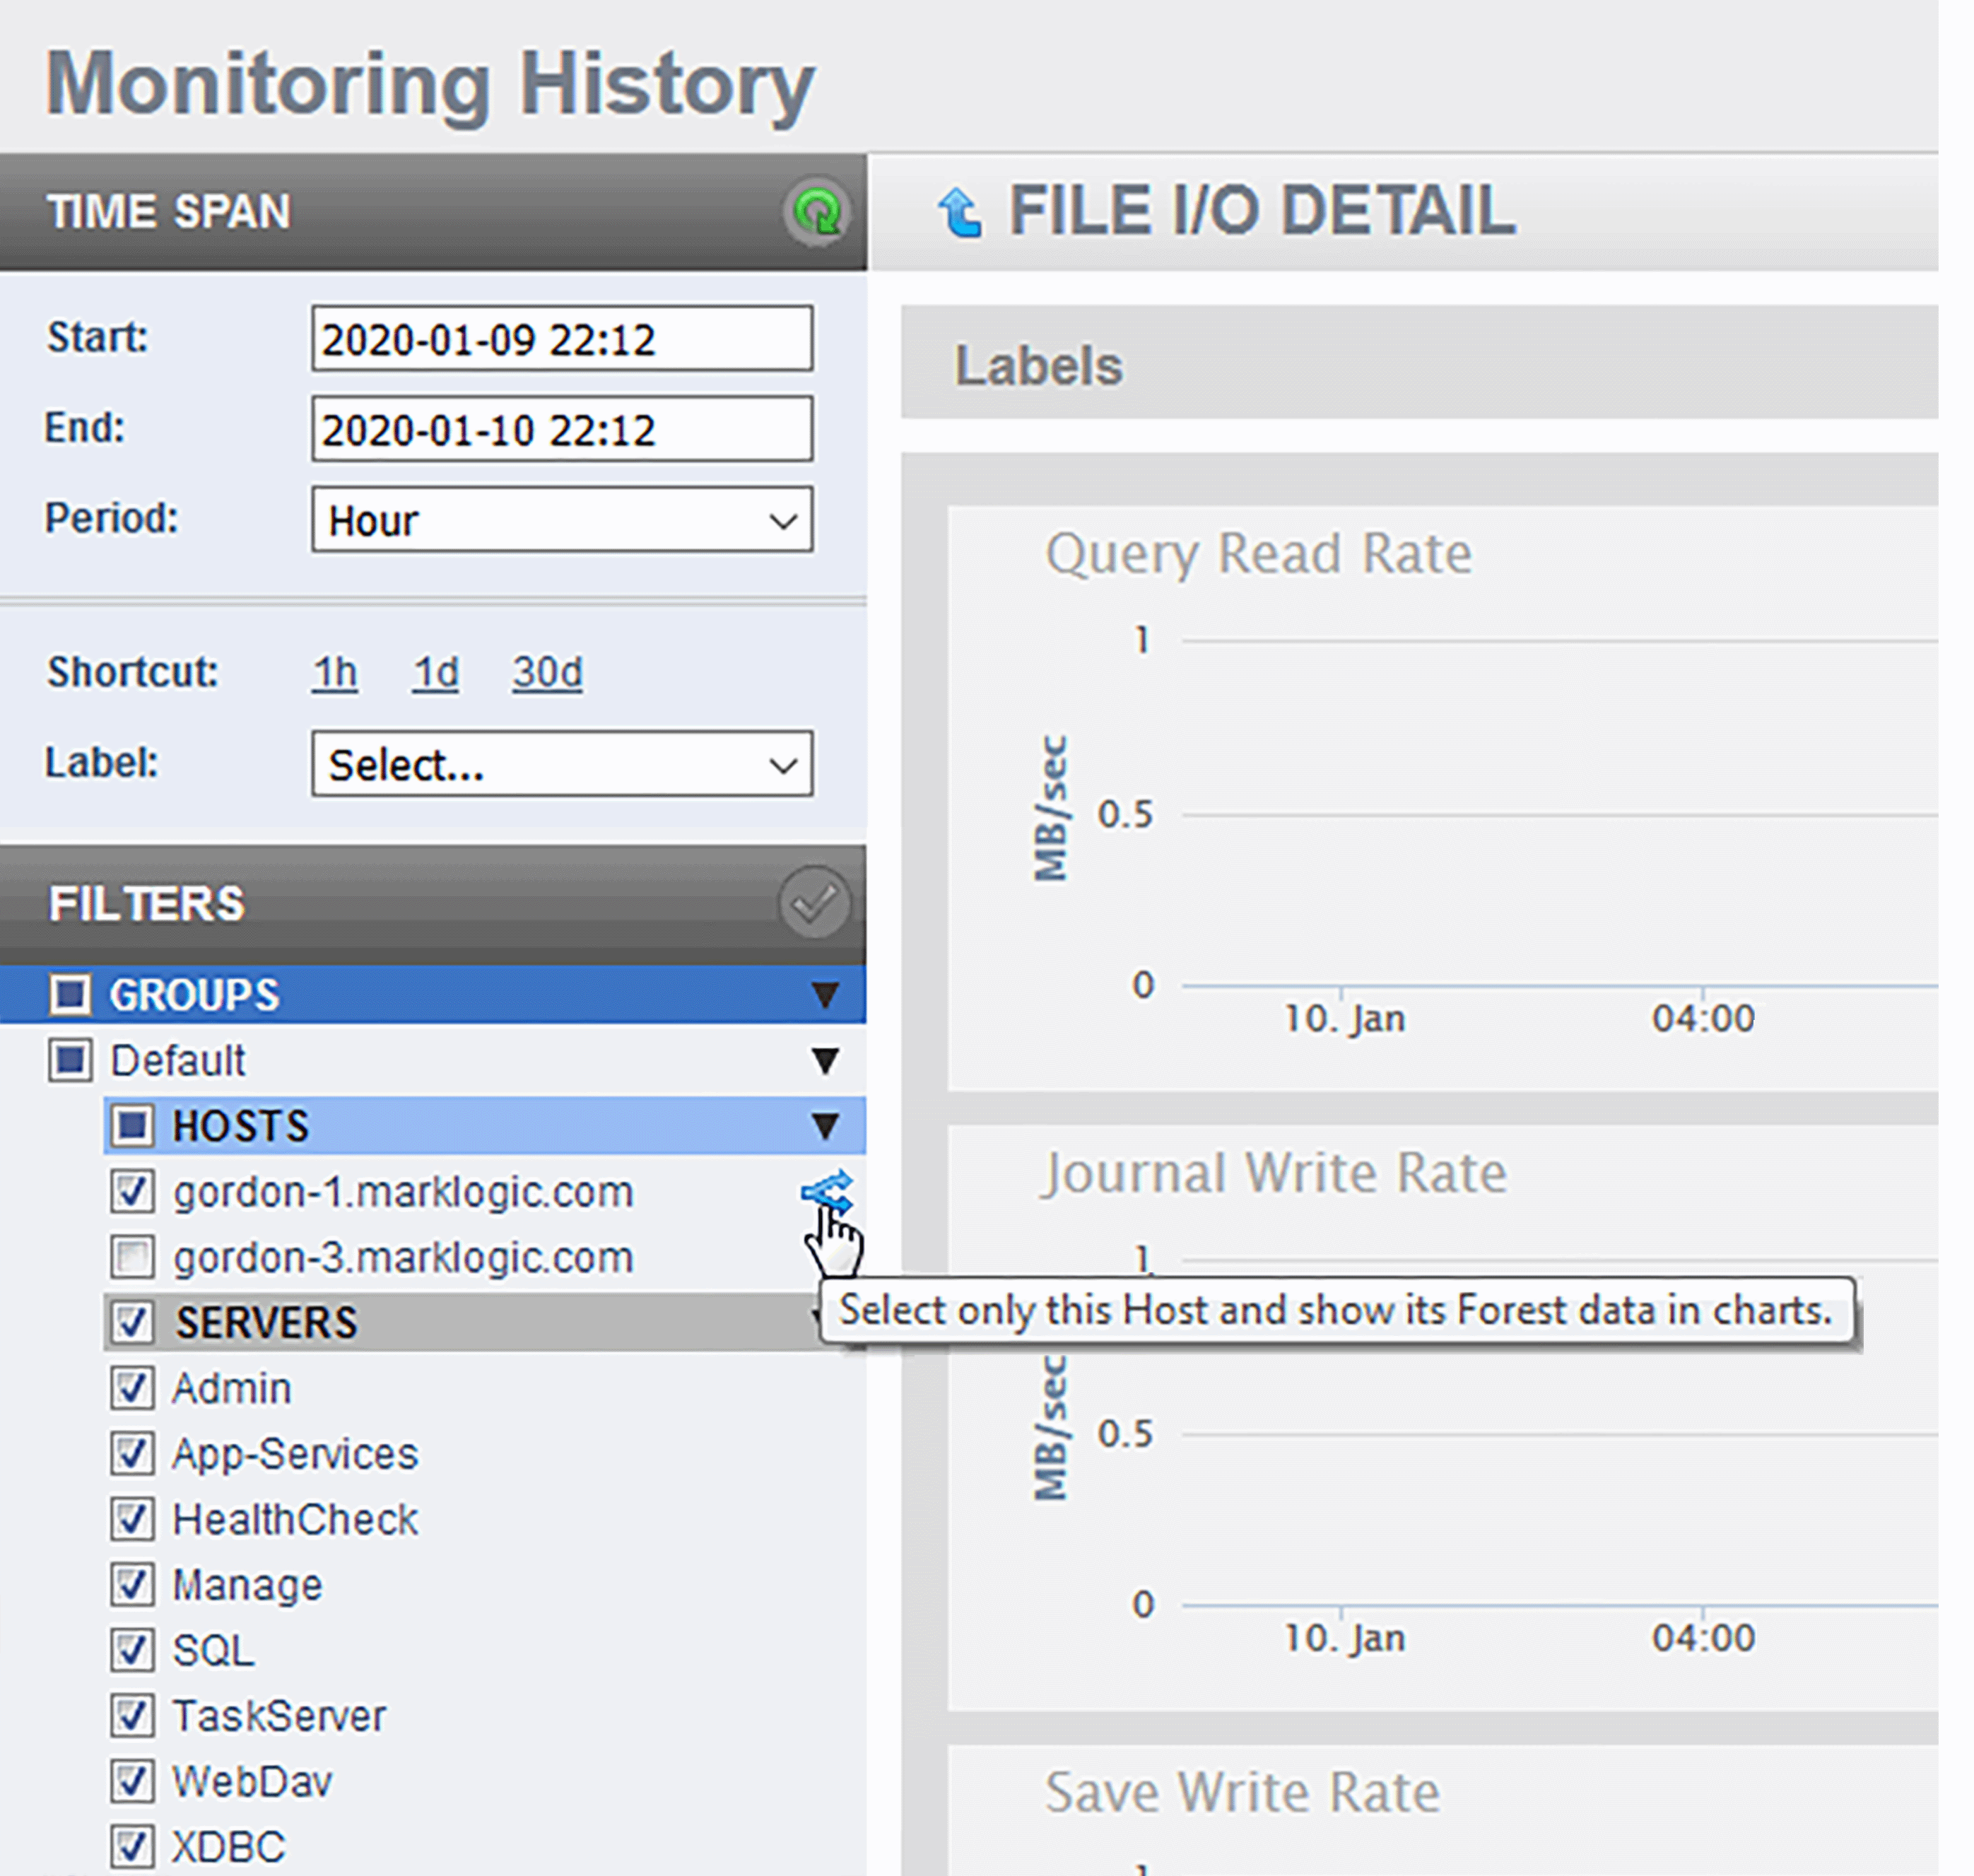
The metrics displayed by the charts on the FILE I/O DETAIL page are described in the following table.
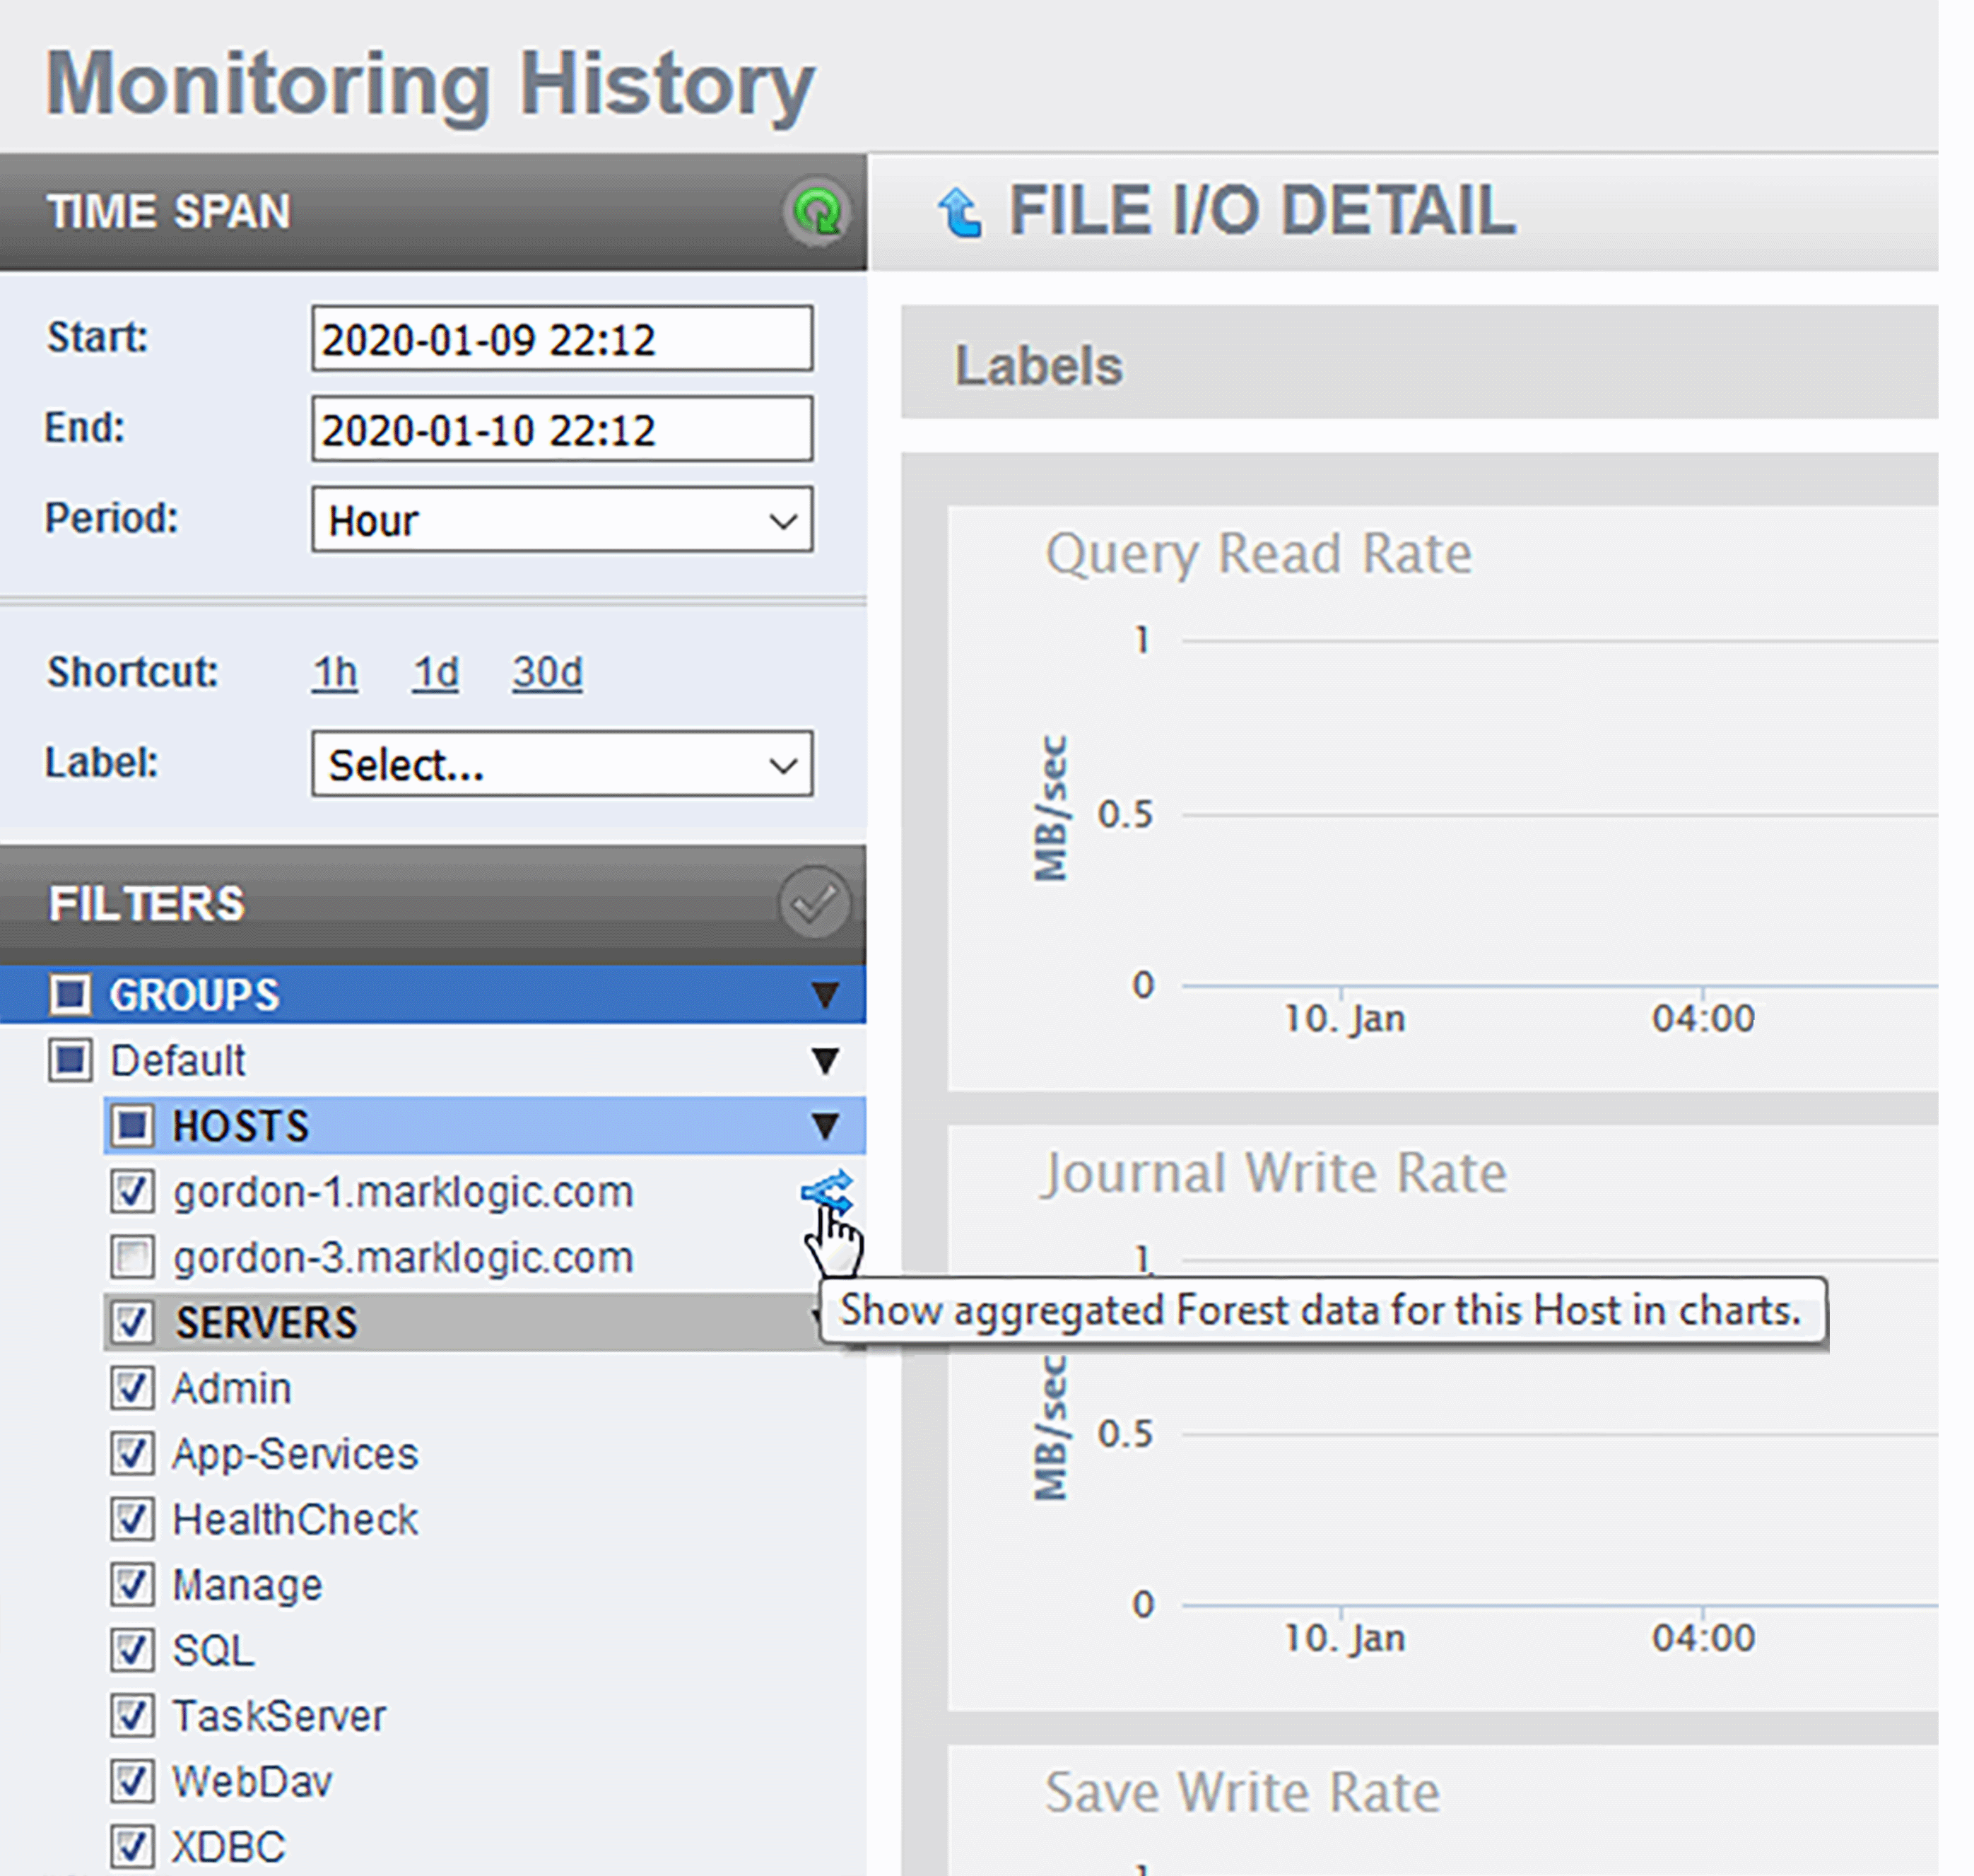
By default, Host data is viewed in aggregated form and must be viewed that way if multiple hosts are selected. When in the FILE I/O DETAIL page, you can rollover any Host filter to reveal the Select and Expand button. This will deselect all of the other Hosts across all Groups, and apply all pending filter changes. The expanded charts display the data for each forest in that host as separate line in each chart.
To return to the aggregate view, click on Aggregate button on an expanded Host. Doing so will also apply all pending filter changes to the displayed charts.
Memory Performance Data
The Overview page displays a graph of the aggregate performance data for the Memory used by the hosts selected in the filter.
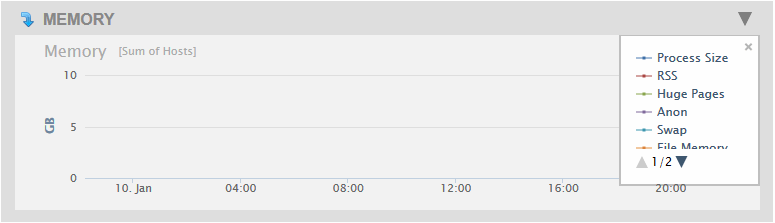
As described in Viewing Monitoring History, you can hover on a period point to view what CPU operation was taking place at that point in time. Each chart and associated performance metrics are described in the following table.
Click on the arrow in the upper left-hand section of the MEMORY graph in the Overview page to view graphs that present more detailed MEMORY performance metrics. The charts on the MEMORY DETAIL page are described in the following table. The displayed metrics are drawn from /proc/vmstat.
XDQP Server Requests Performance Data
The Overview page displays a graph of the aggregate performance data for the XDQP Server Requests processed by the hosts selected in the filter.
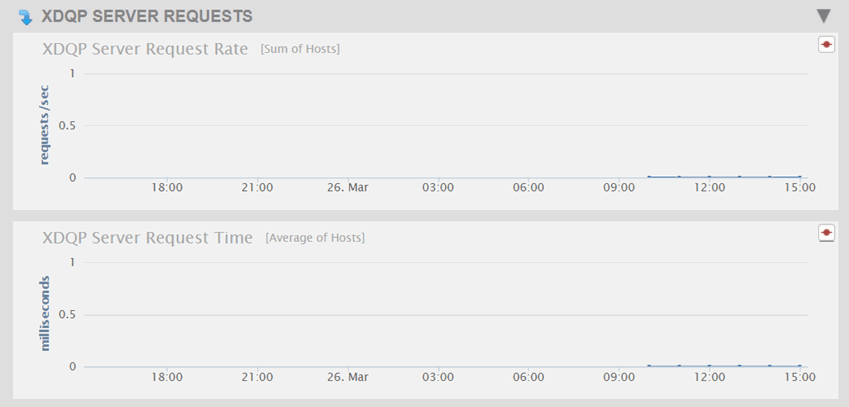
Each chart and associated performance metrics are described in the following table.
| Chart | Description |
|---|---|
| XDQP Server Request Rate | Number of XDQP requests processed per second. |
| XDQP Server Request Time | Average response time to XDQP requests from other nodes. |
Click on the arrow in the upper left-hand section of the XDQP SERVER REQUESTS graph in the Overview page to view graphs that present more detailed performance metrics. The charts on the XDQP SERVER REQUESTS DETAIL page are described in the following table.
| Chart | Description |
|---|---|
| XDQP Server Request Rate | Number of XDQP requests processed per second. |
| XDQP Server Request Time | Average response time to XDQP requests from other nodes. |
Server Performance Data
The Overview page displays graphs of the aggregate performance data for the App Servers selected in the filter.
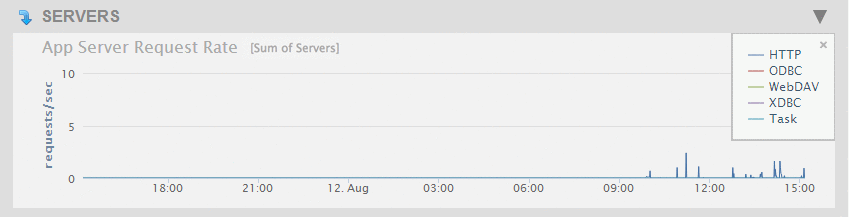
The Overview page displays the charts described in the following table.
With the exception of the Task Server Queue Size chart, which only displays the queue size for the one task server, the color-coded metrics for the server charts are as shown in the following table.
Click on the arrow in the upper left-hand section of the SERVERS graph in the Overview page to view graphs that present more detailed performance metrics for each App Server. The charts displayed on the SERVERS DETAIL page are described in the following table.
If there are multiple groups defined, server names have the group that they are associated with in square brackets in the legend and rollovers.
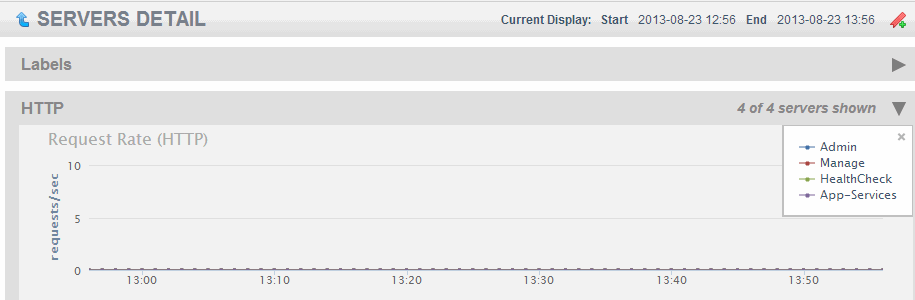
The number of servers displayed out of the number of servers of each type in the cluster (for example, HTTP) is shown in the upper right-hand section of each server type group.

The following detailed charts are displayed for each type of App Server:
Network Performance Data
The network performance data graphs display performance in terms of XDQP reads and writes. XDQP is the protocol MarkLogic uses for internal host-to-host communication on port 7999.
The Overview page displays various XDQP performance as the sum of XDQP activity across the cluster. High XDQP rates are usually not an issue unless they are so high as to saturate your internal network. Higher usage occurs during data load and query execution. Merges do not involve XDQP.
If XDQP is excessively high during loads, running the MarkLogic Content Pump (mlcp) with fast forest placement will minimize XDQP communication needs. For details on the MarkLogic Content Pump, see Loading Content Using MarkLogic Content Pump in the Loading Content Into MarkLogic Server Guide.
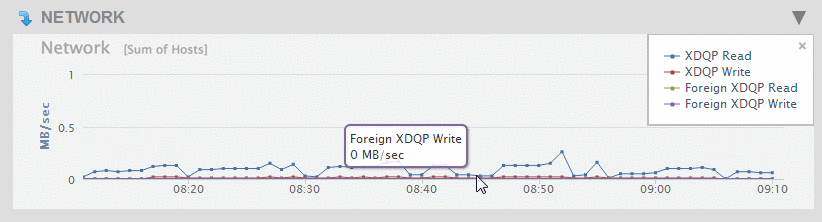
The Overview page displays a chart with the metrics described in the following table.
Click on the arrow in the upper left-hand section of the NETWORK graph in the Overview page to view graphs that present more detailed performance metrics for each host in the cluster. The charts displayed on the NETWORK DETAIL page are described in the following table.
Database Performance Data
The Overview page displays graphs of the aggregate performance data for all of the databases in the cluster.
The following table describes the charts displayed in the Databases section of the Overview page.
Click on the arrow in the upper left-hand section of the DATABASES graph in the Overview page to view graphs that present more detailed performance metrics for each database. The charts displayed on the DATABASES DETAIL page are described in the following table. The metrics for each database in the cluster are displayed as a separate line.
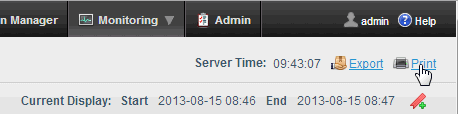
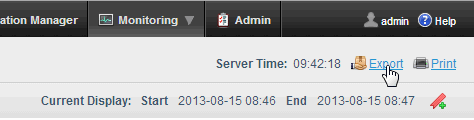
Exporting and Printing Monitoring History
You can export and print your monitoring history data.
To export the monitoring history data to an Excel Spreadsheet file, click the Export at the upper-right portion of the Monitoring History page.
The metrics are displayed in separate tabs at the bottom of the spreadsheet.
To print out the charts displayed on the current page, click Print. This will open the printer dialog page from which you can print the charts.