
MarkLogic Server 11.0 Product DocumentationQuery Performance and Tuning Guide — Chapter 5
Profiling Requests to Evaluate Performance
This chapter describes how to use the Performance Profiler built-in functions to examine the performance characteristics of XQuery and Server-Side JavaScript requests in MarkLogic Server. The profiling APIs enable you to gather statistics about the evaluation of your code on a per-request basis.
This chapter covers the following topics:
- Enabling Profiling on an App Server
- Understanding XQuery Profiling
- Understanding Server-Side JavaScript Profiling
- Profiling Examples
You can also use Query Console to profile your programs, as described in Profiling a Query in the Query Console User Guide.
Enabling Profiling on an App Server
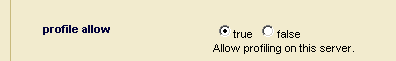
To use the profiling API, you must first enable profiling on the App Server hosting your XQuery or Server-Side JavaScript program (or on the task server if you are profiling spawned queries).
The profile allow option must be set to true on the App Server configuration page in the Admin UI. For example:
Understanding XQuery Profiling
This section describes profiling XQuery code and includes the following topics:
Definitions and Terminology for the XQuery Profiling
The following table lists some terms and their definitions used in describing the XQuery profile API. Several of these terms are used in the data you can generate with the profiling API.
| Term | Definition |
|---|---|
| XQuery Program | The XQuery main module fully expanded with any XQuery library modules needed for its evaluation. An XQuery program is sometimes referred to as a query, a statement, or a request. For more details on this terminology, see Understanding Transactions in MarkLogic Server in the Application Developer's Guide. |
| profiler | An application which measures the performance characteristics of a running program (in the case MarkLogic Server, of an XQuery program). |
| expression | The basic parse element of an XQuery program. Expressions can represent literal values, arithmetic operations, functions, function calls, and so on. Expressions can contain other expressions. |
| shallow time | The time spent evaluating a specific expression, not including time spent evaluating any expressions contained within the specific expression. |
| deep time | The total time spent evaluating an expression, including time spent evaluating any expressions contained within the specific expression. |
| elapsed time | Both shallow and deep time are expressed in elapsed wall clock time. |
| profile report | An XML report containing statistics for all of the expressions evaluated while profiling was enabled. For a sample profile report, see Simple Enable and Disable XQuery Example. |
XQuery Profiling Overview
The XQuery profiling API in MarkLogic Server is not a query profile application (a profiler), but you could use the profiling API to build such an application. A profiler would measure the performance characteristics of an XQuery or JavaScript program.
You can use Query Console to generate and review a profiling report; for details, see Profiling a Query in the Query Console User Guide. You can also simply use the profiling API to generate profiling data and then either manually analyze the data or use XQuery to extract details and format a report.
When profiling is enabled, you can use the prof:enable, prof:report, and other profile functions to generate profiling statistics for the evaluation of individual XQuery programs.
The XQuery profiling API cannot see into a Server-Side JavaScript function. If your code calls a JavaScript function, you will only see data for the top level call, not any JavaScript functions called by that function. The time spent appears as a single block.
Profiling helps you see where a query is spending its processing time. MarkLogic gathers statistics during the evaluation portion of the query, at the individual expression level. Time spent in the data node portion of the query (time spent gathering content from the forests) is included in the expression time for the expression that requested the content from the forest (for example, a cts:search). For each expression, the profile report shows the shallow time and the deep time (see Definitions and Terminology for the XQuery Profiling for these definitions).
All profiling information is gathered on a per-request basis; there is no notion of profiling a set of requests, although it is possible to write an application that performs such aggregation.
XQuery Profiling API
The following functions are included in the XQuery Performance Profiler API:
For details on the APIs and for their function signatures, see the MarkLogic XQuery and XSLT Function Reference. Note the following about the XQuery profile APIs.
- If profiling is not enabled on the App Server and in the XQuery program (via prof:enable), then profile APIs do not do anything except return the empty sequence.
- You can profile the currently running request (
prof:enable(xdmp:request())), an evaluated request (prof:eval), or an invoked module (prof:invoke). To profile other requests, you need to debug the request; if you try to profile another request, MarkLogic Server throws theDBG-NOTSTOPPEDexception. - Constants (for example,
47or"hello") do not show up in the profile report. - Constructed elements do not show up in the profile report.
- Profile time starts after the static analysis phase of query evaluation; it does not include the query parsing time.
- All of the profile APIs are in the
http://marklogic.com/xdmp/profilenamespace. Theprofprefix is bound to this namespace, and is pre-configured in MarkLogic Server (so there is no need to define this namespace in your XQuery prolog). - If you profile a request besides the currently running request, or if you start a new request for profiling using prof:eval or prof:invoke, you need one of the privileges
http://marklogic.com/xdmp/privileges/profile-my-requests(to profile a request issued by the same user ID) orhttp://marklogic.com/xdmp/privileges/profile-any-requests(to profile a request issued by any user ID). If you are profiling the currently running request, no privileges are required.
Understanding Server-Side JavaScript Profiling
Profiling for Server-Side JavaScript is only available through the prof.eval built-in function or through Query Console. Profiling must be enabled for your App Server, as described in Enabling Profiling on an App Server. To learn about generating a profiling report using Query Console, see Profiling a Query in the Query Console User Guide.
When you profile Server-Side JavaScript, MarkLogic collects a CPU Profile from the JavaScript engine. The profiling data generated for JavaScript is based on sampling, so it will not reflect all functions called or accurate function hit counts. However, those areas of your code that consume the most CPU will still be readily apparent.
The JavaScript profiler cannot profile XQuery code. If your JavaScript code calls into XQuery, the time spent inside the XQuery function is a single block. The called XQuery function name will not include a namespace identifier in the profiling data.
You can save the output from profiling JavaScript to a file and import the data into the Profiles tab of the Chrome developers to analyze the data outside of MarkLogic. Query Console enables you to download a profiling report from within its UI.
You can also generate and save your own profiling report from prof.eval with code similar to the following:
'use strict';
const myQuery = "your code (as string) here";
xdmp.save(
  '/space/rest/junk.cpuprofile',
  fn.head(prof.eval(myQuery))
);
Profiling Examples
The following are code examples showing some simple usage patterns for the profile API. For details on the APIs, see the MarkLogic XQuery and XSLT Function Reference. This section shows the following examples:
- Simple Enable and Disable XQuery Example
- Returning a Part of the XQuery Profile Report
- JavaScript Profile Example
Simple Enable and Disable XQuery Example
The following examples show simple uses for the profile API.
let $req := xdmp:request()
let $dummy1 := prof:enable($req)
let $version := xdmp:version()
let $node :=
  <foo>
    <version>{$version}</version>
    <request>{$req}</request>
  </foo>
let $dummy2 := prof:disable($req)
let $dummy3 := fn:current-dateTime()
let $dummy4 := prof:enable($req)
let $dummy5 := 47
let $dummy6 := $node/foo/request
let $dummy6 := prof:disable($req)

return
prof:report($req)
This query returns the following report:
<prof:report
  xsi:schemaLocation="http://marklogic.com/xdmp/profile profile.xsd"
  xmlns:xsi="http://www.w3.org/2001/XMLSchema-instance"
  xmlns:prof="http://marklogic.com/xdmp/profile">
  <prof:metadata>
    <prof:overall-elapsed>PT0S</prof:overall-elapsed>
    <prof:created>2014-03-19T14:20:18.763-07:00</prof:created>
    <prof:server-version>7.0-4</prof:server-version>
  </prof:metadata>
  <prof:histogram>
    <prof:expression>
      <prof:expr-id>6467258264555963988</prof:expr-id>
      <prof:expr-source>xdmp:version()</prof:expr-source>
      <prof:uri/>
      <prof:line>3</prof:line>
      <prof:count>1</prof:count>
      <prof:shallow-time>PT0S</prof:shallow-time>
      <prof:deep-time>PT0S</prof:deep-time>
    </prof:expression>
    <prof:expression>
      <prof:expr-id>127913224145561857</prof:expr-id>
      <prof:expr-source>prof:disable($req)</prof:expr-source>
      <prof:uri/>
      <prof:line>9</prof:line>
      <prof:count>1</prof:count>
      <prof:shallow-time>PT0S</prof:shallow-time>
      <prof:deep-time>PT0S</prof:deep-time>
    </prof:expression>
    <prof:expression>
      <prof:expr-id>8377097069965042614</prof:expr-id>
      <prof:expr-source>prof:disable($req)</prof:expr-source>
      <prof:uri/>
      <prof:line>14</prof:line>
      <prof:count>1</prof:count>
      <prof:shallow-time>PT0S</prof:shallow-time>
      <prof:deep-time>PT0S</prof:deep-time>
    </prof:expression>
    <prof:expression>
      <prof:expr-id>10959125668150171452</prof:expr-id>
      <prof:expr-source>prof:enable($req)</prof:expr-source>
      <prof:uri/>
      <prof:line>2</prof:line>
      <prof:count>1</prof:count>
      <prof:shallow-time>PT0S</prof:shallow-time>
      <prof:deep-time>PT0S</prof:deep-time>
    </prof:expression>
    <prof:expression>
      <prof:expr-id>1823871875827665493</prof:expr-id>
      <prof:expr-source>$node/child::foo/child::request
        </prof:expr-source>
      <prof:uri/>
      <prof:line>14</prof:line>
      <prof:count>1</prof:count>
      <prof:shallow-time>PT0S</prof:shallow-time>
      <prof:deep-time>PT0S</prof:deep-time>
    </prof:expression>
    <prof:expression>
      <prof:expr-id>16669888445989754369</prof:expr-id>
      <prof:expr-source>prof:enable($req)</prof:expr-source>
      <prof:uri/>
      <prof:line>11</prof:line>
      <prof:count>1</prof:count>
      <prof:shallow-time>PT0S</prof:shallow-time>
      <prof:deep-time>PT0S</prof:deep-time>
    </prof:expression>
  </prof:histogram>
</prof:report>
You might note that the times are all zero. That is because this example does a trivial amount of work, and each expression took less than a millisecond to complete. But it does illustrate some things that are useful when looking at the report:
- The
fn:current-dateTime()function does not appear in the report, because profiling was disabled at this stage of the XQuery program. - The expressions are not necessarily in the order they are in the XQuery program. If you want them in order, you can take the
prof:expressionelements and order them by theprof:lineelement (or one of the time elements, or whatever makes sense for your reports). - While the expression 47 occurs while profiling is enabled, it does not show up in the output because it is just a constant, and constants do not appear in the profile report.
Returning a Part of the XQuery Profile Report
Because the profile report is XML, you can use XQuery to manipulate the report to suit your needs. The following example returns only a expression elements of the profile report, wraps it in an element, and orders it by the deep time element.
xquery version "1.0-ml";

let $req := xdmp:request()
let $dummy := prof:enable($req)
let $foo := for $i in fn:doc() return xdmp:node-uri($i)
let $dummy2 := prof:disable($req)
return <foo>{
   for $j in prof:report($req)//*:expression
     order by xs:dayTimeDuration($j/*:deep-time)
     return $j
}</foo>
To see the results, copy the code and run it against MarkLogic Server. You will need to enable profiling on the HTTP Server Configuration page, otherwise the report will be empty.
JavaScript Profile Example
In Server-Side JavaScript, you can profile a JavaScript program as shown below. You can load this output into the Profiles tab of the Chrome developer tools to for further analysis:
prof.eval('cts.search("hello")')
=>
{
  "nodes": [
  {
    "id": 1,
    "callFrame": {
      "functionName": "(root)",
      "scriptId": 0,
      "url": "",
      "lineNumber": 0,
      "columnNumber": 0
    },
    "hitCount": 0,
    "children": [
    2
    ]
  },
  {
    "id": 2,
    "callFrame": {
      "functionName": "",
      "scriptId": 9,
      "url": "/qconsole/endpoints/evaljs.sjs",
      "lineNumber": 1,
      "columnNumber": 1
    },
    "hitCount": 0,
    "children": [
    3
    ]
  },
  {
    "id": 3,
    "callFrame": {
      "functionName": "addResponseHeader",
      "scriptId": 0,
      "url": "",
      "lineNumber": 0,
      "columnNumber": 0
    },
    "hitCount": 0,
    "children": [
    4
    ]
  },
  {
    "id": 4,
    "callFrame": {
      "functionName": "doEval",
      "scriptId": 10,
      "url": "/MarkLogic/appservices/qconsole/qconsole-js-amped.sjs",
      "lineNumber": 37,
      "columnNumber": 18
    },
    "hitCount": 0,
    "children": [
    5
    ]
  },
  {
    "id": 4,
    "callFrame": {
      "functionName": "doEval",
      "scriptId": 10,
      "url": "/MarkLogic/appservices/qconsole/qconsole-js-amped.sjs",
      "lineNumber": 37,
      "columnNumber": 18
    },
    "hitCount": 0,
    "children": [
    5
    ]
  }
,
  {
    "id": 5,
    "callFrame": {
      "functionName": "",
      "scriptId": 9,
      "url": "/MarkLogic/appservices/qconsole/qconsole-js-amped.sjs",
      "lineNumber": 24,
      "columnNumber": 20
    },
    "hitCount": 0,
    "children": [
    6
    ]
  }
,
  {
    "id": 6,
    "callFrame": {
      "functionName": "eval",
      "scriptId": 0,
      "url": "",
      "lineNumber": 0,
      "columnNumber": 0
    },
    "hitCount": 0,
    "children": [
    7
    ]
  }
,
  {
    "id": 7,
    "callFrame": {
      "functionName": "",
      "scriptId": 9,
      "url": "/MarkLogic/appservices/qconsole/qconsole-js-amped.sjs",
      "lineNumber": 29,
      "columnNumber": 24
    },
    "hitCount": 0,
    "children": [
    8
    ]
  }
,
  {
    "id": 8,
    "callFrame": {
      "functionName": "",
      "scriptId": 9,
      "url": "/MarkLogic/appservices/qconsole/qconsole-js-amped.sjs",
      "lineNumber": 40,
      "columnNumber": 34
    },
    "hitCount": 0,
    "children": [
    9
    ]
  },
  {
    "id": 9,
    "callFrame": {
      "functionName": "",
      "scriptId": 0,
      "url": "",
      "lineNumber": 0,
      "columnNumber": 0
    },
    "hitCount": 0,
    "children": [
    10
    ]
  }
,
  {
    "id": 10,
    "callFrame": {
      "functionName": "",
      "scriptId": 10,
      "url": "",
      "lineNumber": 1,
      "columnNumber": 1
    },
    "hitCount": 0,
    "children": [
    11
    ]
  }
,
  {
    "id": 11,
    "callFrame": {
      "functionName": "eval",
      "scriptId": 0,
      "url": "",
      "lineNumber": 0,
      "columnNumber": 0
    },
    "hitCount": 0,
    "children": [
    ],
    "positionTicks": [
        {
        "line": 1,
        "ticks": 1
        }
      ]
    }
  ],
  "startTime": 1395946483445,
  "endTime": 1395946497345,
  "samples": [
    11,
    11
  ],
  "timeDeltas": [
    12161,
    1132
  ]
}