View monitoring history by time span and frequency
As described in Enabe monitoring history on a group, the frequency in which performance metrics are captured is configurable, in minute intervals. The snapshots of performance metrics for each host are rolled up into a summary document that contains aggregate calculations on the values for that host.
You can configure your view of the captured performance data by time span and frequency. The Time Span settings are located in the upper left corner of the Monitoring History page.
There are three basic settings you can adjust to control how the data is displayed:
A date/time range, down to the granularity of a minute, that determines the time span of the displayed data. (By default, this is the last 24 hours.)
A period interval that determines the frequency of the displayed data. The possible intervals are shown in the following table.
Period |
Description |
|---|---|
Raw |
Display the performance data just as it was captured with the set frequency. |
Hour |
Display the performance data, in aggregate form, per hour. (This is the default.) |
Day |
Display the performance data, in aggregate form, per day. |
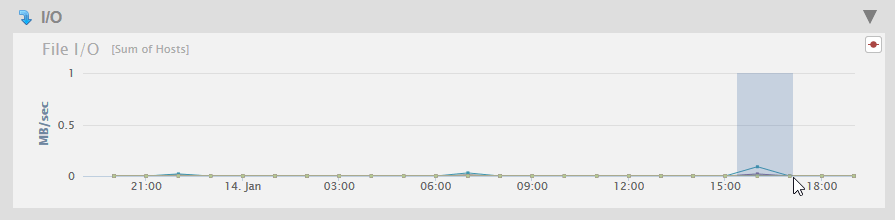
To “zoom in” to display part of the timespan, select the begin time of your “zoom” on any chart and drag your left mouse button to the end “zoom” time. The selected timeframe is highlighted and the zoomed-in time is displayed for all of the charts in the page. Navigating to another Monitoring History page resets all of the charts to the timespan selected in the TIME SPAN panel.
After changing either the time span or the period, click refresh to display the updated charts. Clicking refresh will also update any changes you have made to the Filters settings. For details about filters, see Filter monitoring history by resources. If you have zoomed into a portion of a timespan, refresh will redisplay the charts using the timespan selected in the TIME SPAN panel.
You can use the Shortcut links to display either the last hour, day or 30 days of performance data. Selecting a Shortcut link will automatically refresh the displayed charts.
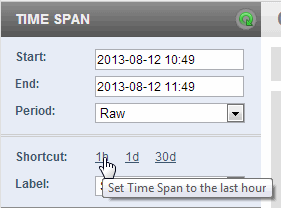
Each Shortcut also sets the Period value, as shown in the following table.
Shortcut |
Period |
|---|---|
1h |
Raw |
1d |
Hour |
30d |
Day |