Historical performance charts by resource
From the Monitoring History dashboard, you can view Overview and Detailed performance metrics in graph form for each resource in the cluster. In the Overview page, the lines on a graph represent an aggregate of the metrics for all of the cluster resources of that type. In each Details page, the lines represent the metric for each specific resource in the cluster.
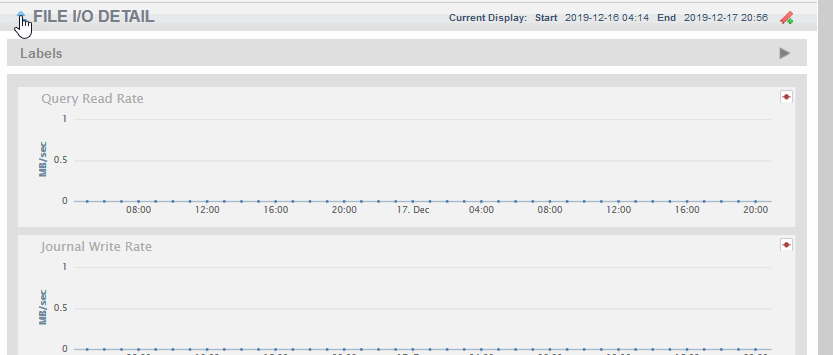
To view the Detail page for a resource, click on the down arrow at the upper left-hand section of the resource graph on the Overview page.

To return to the Overview page from a Detail page, click on the up arrow at the upper left-hand section of the resource graph on the Detail page.
