MarkLogic Server 11.0 Product DocumentationQuery Console User Guide — Chapter 4
Query Console Walkthrough
This chapter provides a quick introduction to using the core Query Console features.
- Accessing Query Console
- Creating a Query
- Running a Query
- Changing the Query Output Format
- Using the Query Execution History
- Profiling a Query
- Viewing Query Plans
- Exploring a Database
- Filtering the Explorer View by URI
- Editing Database Content
- Organizing Queries with Workspaces
Accessing Query Console
To begin using Query Console, open a browser and enter the URL:
http://your_host:8000
If the application does not appear, you may not have sufficient privileges. To use Query Console, you must be a member of the qconsole-user role. If your privileges are insufficient, contact your MarkLogic Server administrator.
Query Console does not grant extra access to databases or documents. To perform operations such as document insertion or deletion or database exploration from Query Console, you must have appropriate security privileges.
The first time you launch Query Console, you should see a page similar to the following:
You should only have one Query Console session active at a time for any given MarkLogic user. Query Console saves state to MarkLogic Server. If a user has multiple Query Console sessions active concurrently, the state can become inconsistent. For example, do not log into Query Console as the same user in multiple browsers or browser tabs.
Creating a Query
This section walks you through creating a new query.
The following example assumes an empty workspace named Workspace, populated only with the default initial XQuery query, named Query 1. This is the configuration you see the first time you launch Query Console.
- If the current workspace is not Workspace, click on the workspace dropdown on the upper right and select the workspace named Workspace.
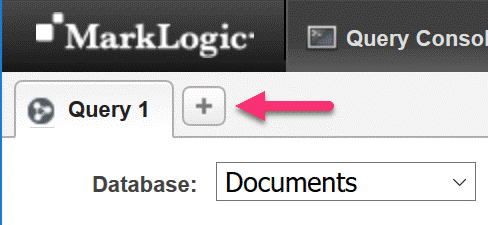
- Click on the "+" at the top of the query editor to the right of the open query tabs. A new query is created and opened in the editor. The new query also appears in the workspace panel on the right.
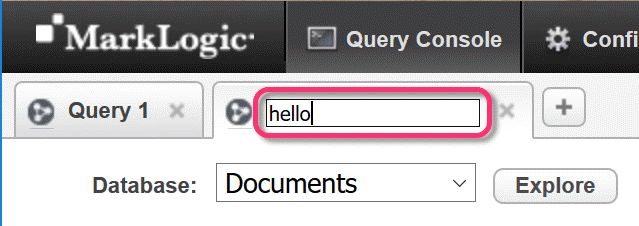
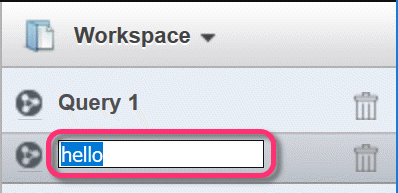
- Double-click on the query name in the tab at the top of the editor and type in a meaningful name for the query, such as
hello. Notice the name changes in the tab and in the workspace panel on the right.You can also rename a query by double-clicking its name in the workspace panel.
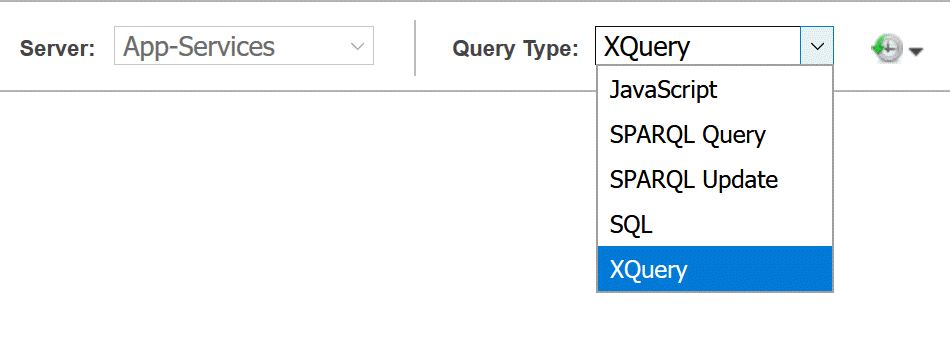
- Choose the query type by clicking on the Query Type dropdown to the right of the Server dropdown list. For this example, select XQuery.
The Query Type determines the evaluation context for your query when you run it. The supported query languages are:
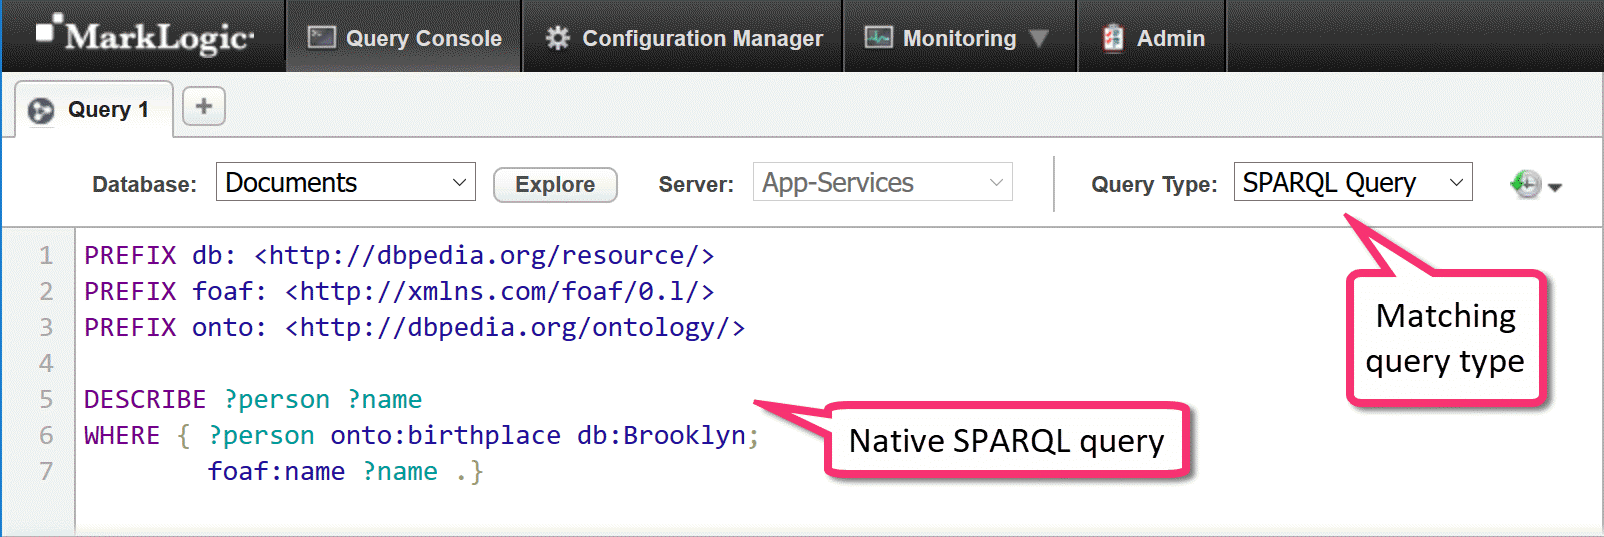
The following example shows a native SPARQL query with the Query Type set appropriately.
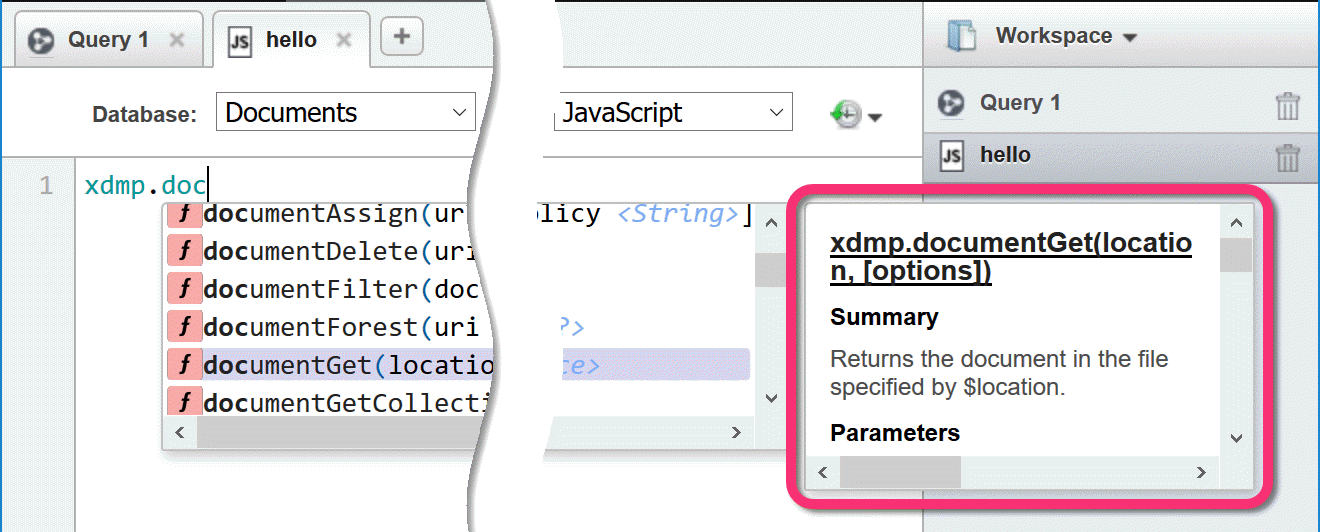
In XQuery and JavaScript, Query Console displays suggestions for matching functions, variables, and keywords as you type. For example:
If you click on a suggestion, Query Console adds the suggestion text to your query. For example, if you select documentGet in the list above, then the following text is entered into your query. You can replace the suggestion parameters with values appropriate to your task.
For a function, Query Console also display reference documentation to the right of the suggestions. For example:
Running a Query
Follow this procedure to evaluate a query and view the results. You should already have entered your query in the query editor and selected the appropriate Query Type. If not, refer to Creating a Query.
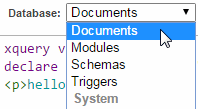
- Click on the Database dropdown at the top of the editor to select the content database against which to run the query. For this example, you can use any database.
- Click on the Server dropdown at the top of the editor to select the App Server against which to run the query. For this example, you can use any App Server.
- Click the Run button to evaluate the query. In this case, the default "hello world" query. The prettyprinted results display in the output pane at the bottom of the page.
- To view the query results as plain text, click the result format dropdown on the far right of the results pane and select Text. Your query results display as plain text.
- To view the query results without prettyprint formatting, click the Raw button on the Result tab. Your raw query results display in the results pane at the bottom of the page. For details, see Changing the Query Output Format.
Each query has its own Results display tab, so you can switch between queries without losing the results of a run.
Each time you run a particular query, the results tab reports how long the query took and the time difference between the current and previous run. For example:
If your query returns a sequence of values, Query console reports the number of items in the sequence so you can distinguish between returning a sequence of one item versus a single item (not in a sequence).
Changing the Query Output Format
Query Console supports two modes for displaying query results, Auto and Raw. The default mode is Auto. In Auto mode, your query results are formatted for readability based on the query and the output type. For example:
- XML and JSON query results are displayed with syntax coloring and UI elements that allow you to expand and collapse the element tree. Sequences are unrolled to line items with individual formatting controls.
- Results from a SQL query (run in SQL mode) are formatted as a table.
- Results from a SPARQL query display matching IRIs.
In Auto mode, you can override the default rendering using the format dropdown at the far right of the results pane.
For example, strings are rendered as text by default, but if you know the string contains serialized JSON, you can change the rendering to JSON to get syntax highlighting and tree controls. The choices on the format dropdown depend on the type of data returned by your query.
Raw mode always displays plain text, but it is not necessarily the query results exactly as returned from MarkLogic Server. Slight formatting changes are still applied to improve readability. For example, even in Raw mode, an XQuery sequence or JavaScript Sequence displays as line items.
Using the Query Execution History
Each time you modify a query and evaluate it, Query Console saves the contents and time of execution in the Query History. Query Console maintains a separate history for each query.
Query Console adds a history entry for each unique version of a query. If the query text is unchanged between runs or if the changes create a duplicate of an existing history entry for the query, Query Console does not create a new entry.
Query Console saves at most 50 history entries.
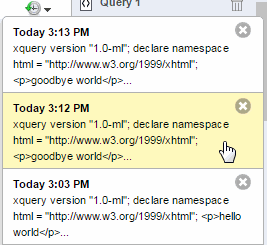
- Click the Query History dropdown on the upper right. The history appears, with the most recent runs at the top of the list.
- To revert the query to a previous state, click on a history entry. The selected query version is restored in the editor.
To remove a history entry, click the delete (X) button in the upper right corner of the entry.
To close the history dropdown, click on the Query History dropdown again, or simply move the mouse outside the dropdown.
Profiling a Query
You can use Query Console to profile the performance of an XQuery or Server-Side JavaScript query. For XQuery, Query Console profiles your query as if you passed your query to prof:invoke, and then displays a performance report in the results pane.
Profiling must be enabled on an App Server before you can profile a query. It is enabled by default when you create an App Server. For details, see Enabling Profiling on an App Server in the Query Performance and Tuning Guide.
Use the following procedure to profile a query:
- Click the Profile tab at the top of the result panel. The profile tab is brought to the front.
- Click the Run button to evaluate your query. A profiling report appears. If no profiling report appears, profiling may not be enabled for your App Server.
In XQuery, your Query Console query appears as the
.mainmodule in the profiling report. In JavaScript, your query appears as(program). - Click on a profiling report column header to sort the profiling data by a particular column. Each time you click a column, the order toggles between ascending and descending.
- Click on the Result tab to view the output from your query.
When profiling a JavaScript query, you can click on the download icon in the upper right of the profiling report to save your profiling data in format that can be imported into the Profiles tab of the Chrome browser developer tools.
For details on profiling queries and the meaning of the profile report columns, see Profiling Requests to Evaluate Performance in Query Performance and Tuning Guide.
Viewing Query Plans
You can use Query Console to view the query plan for a SQL or SPARQL query. Two types of query plan are available: the estimated plan and the actual plan.
When a SQL, SPARQL, or Optic API query is executed, it is first parsed into a tree of operators that will compute the results of the query when executed. This query plan tree is then rearranged by MarkLogic's query optimizer to produce a more efficient query execution strategy.
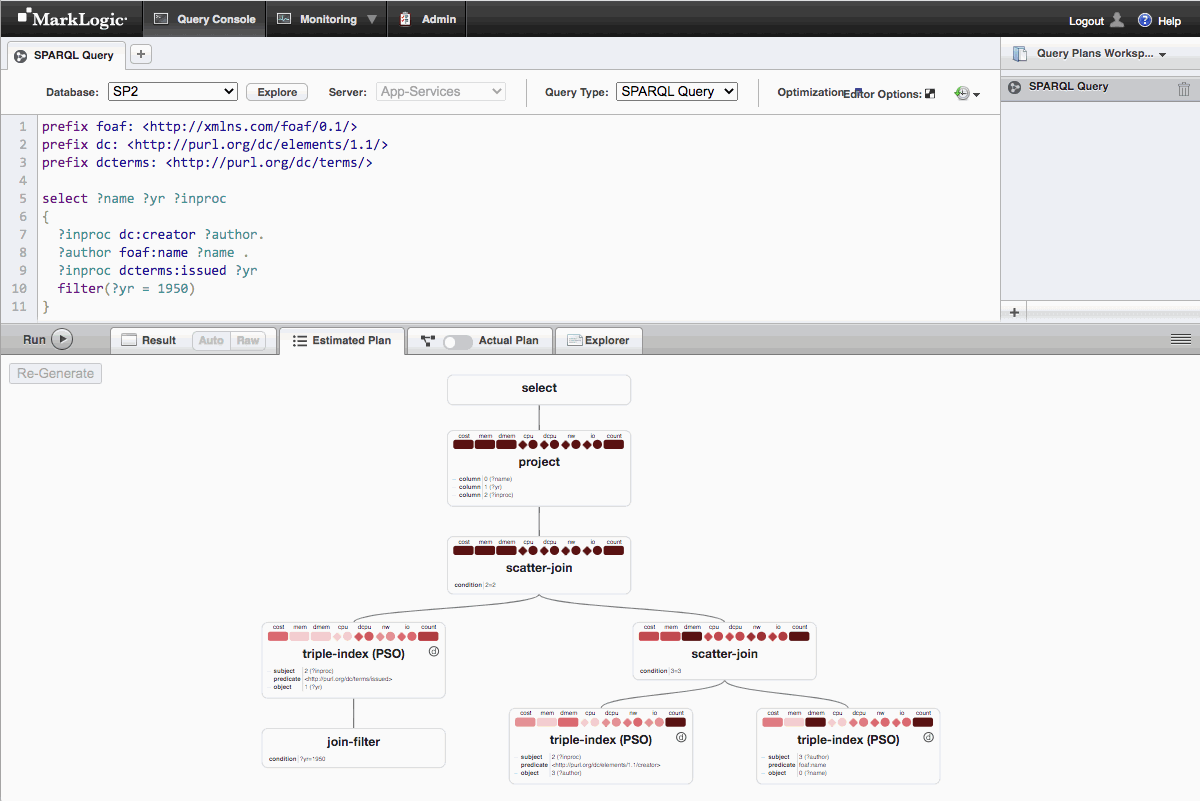
Viewing a query plan shows a graphical representation of the operators used, arranged in a tree structure that shows the flow of information from the leaves (data accessors), via operators (joins, filters, etc.) to the root where the query result will be returned. Each query plan operator displays its name, and a table of pertinent information about the operator. Further information is available in tooltips by hovering over either the title, costs, or table display areas of the operator information box.
It's beyond the scope of this walkthrough to detail everything about the information shown by the query plan viewer. Further information can be found by watching the following videos:
MarkLogic Optic Engine Deep Dive: Query Plans and Operators
MarkLogic Optic Engine Deep Dive: Optimization
In MarkLogic 10.0-8, the Query Plan Viewer does not work with the Windows IE 11 browser.
The Estimated Plan
The estimated plan can be used to understand how the query will be executed, and how the query optimizer has assigned costs and chosen that query plan.
The estimated plan is available before the query has been executed. It contains a graphical representation of information on the costs assigned to each query plan operator by the query optimizer. This representation uses a row of red shaded shapes below the operator title - each shape is a different cost metric, and the deeper the shade of colour the higher the value of the metric is compared to the maximum value for that metric across all operators in the plan.
To view the estimated plan, switch to the tab in the results pane. The query plan display is not updated automatically, so the "Generate" button needs to be clicked to update the display if the query has changed since the plan was last viewed.
The Actual Plan
The actual plan can be used to understand how a query executed, and where memory and time were spent during that query execution.
The actual plan is only available after the query has been executed. It is only produced if the check box on the "Actual Plan" tab is activated, and the instrumentation used to create it reduces the performance of the query executed. The actual plan contains a graphical representation of information for each operator that is measured during the query execution, including row count, execution time, and peak memory usage. This representation uses a row of red shaded shapes below the operator title - each shape is a different execution metric, and the deeper the shade of colour the higher the value of the metric is compared to the maximum value for that metric across all operators in the plan.
To view the actual plan, slide the check box on the "Actual Plan" tab to on, and run the query using the run button. After this, switching to the "Actual Plan" tab will display the query plan annotated with runtime information.
Exploring a Database
Use the Explorer feature to browse the contents of a database. This topic explains how to use the Explorer to explore the contents of a database. You can also use the Explorer to modify database contents; for details, see Editing Database Content.
- Select a database from the Database dropdown at the top of the current query.
- Click Explore, to the right of the Database dropdown. Query Console displays a list of the documents in the selected database in the Explorer. For example:
For each document in the database, the summary includes the document URI, the type and name of the root node, a link to the document properties, and a link to any collections to which the document belongs.
- Optionally, enter a wildcard expression or URI in the search box to filter the list of documents by URI. For more details, see Filtering the Explorer View by URI.
- Click on a document URI to explore the document contents and metadata. The content is displayed by default.
- Click on one of the metadata categories above the content to explore details about that category. For example, click on Metadata to explore the document's key-value metadata:
- Use the forward and back buttons in the upper left of the Explorer to navigate as you drill down into document contents and metadata. For example, to return to the database content summary after clicking on a document's URI, click the back arrow.
- To explore the collections or properties of a document from the document list, click the link in the Collections or Properties column.
Filtering the Explorer View by URI
Use the search box of the Explorer to explore only a specific document or the documents that match a wildcard expression. The match uses the same semantics as the XQuery function cts:uri-match or the Server-Side JavaScript function cts.uriMatch.
The URI lexicon must be enabled on the database you are exploring. You will get an error if the URI lexicon is not enabled.
The following semantics apply to filtering by URI:
- Your regular expression can include the following wildcard characters. These characters can occur multiple times and in any position.
- If all the non-wildcard characters in your expression are lower case, then the matching is case insensitive. Otherwise, the matching is case sensitive.
- If your regular expression contains no diacritics, then the matching is diacritic insensitive. Otherwise, the matching is diacritic sensitive.
- The URI filter is combined with any collection filter. For example if you enter "*.xml" in the search box and then click on the name of a collection in the Collections column of the Explorer, you see documents in that collection that end with ".xml".
The following table contains some examples of filtering expressions:
Editing Database Content
You can use the Explorer to modify your database content without writing code. See the following topics for details:
You can only insert or update content. You cannot modify metadata such as permissions and properties.
Inserting a New Document
You can insert a new document into a database from the Explorer. You must be logged into Query Console as a user with sufficient privileges to create the document in the database.
You cannot set the metadata for the new document using the Explorer. New documents are created with default permissions, collections, quality, properties, and key-value metadata, as when calling xdmp:document-insert or xdmp.documentInsert with no options.
Use the following procedure to create a new document:
- Select the target database from the Database dropdown at the top of the current query.
- Click Explore, to the right of the Database dropdown. Query Console displays a list of the documents in the selected database in the Explorer.
- Click the New button at the top of the Explorer. Query Console displays the document editor. If the New button is greyed out, you do not sufficient privileges to create a new document.
- Enter the content and URI of the new document. For example:
- Click Save. Query Console inserts the document into the database.
Modifying an Existing Document
You can modify an existing document in a database from the Explorer. You must be logged into Query Console as a user with sufficient privileges to create the document in the database.
You cannot modify the metadata for a document using the Explorer.
Note that when you view a document in the Explorer, Query Console prettyprints what you see to make it more readable. When you edit a document, the contents are displayed exactly as stored in the database, so the content displayed in the editor may look different.
Use the following procedure to create a new document:
- Select the target database from the Database dropdown at the top of the current query.
- Click Explore, to the right of the Database dropdown. Query Console displays a list of the documents in the selected database in the Explorer.
- Locate the document you want to change in the document list.
- Click on the document URI in the document list. Query Console displays the contents of the document.
- Click the Edit button in the upper right corner of the document view. Query Console displays the document editor.
- Make changes to the document content and/or URI.
- Click Save. Query Console updates the document in the database.
If the document changes during the edit session, Query Console displays a dialog that enables you to discard your changes, reload the editor with the new content, or overwrite the new content your changes.
Deleting Documents
You can delete documents without writing code using the Explorer. You can only delete documents from the database if you have sufficient privileges for the operation.
Use the following procedure to delete documents:
- Select the target database from the Database dropdown at the top of the current query.
- Click Explore, to the right of the Database dropdown. Query Console displays a list of the documents in the selected database in the Explorer.
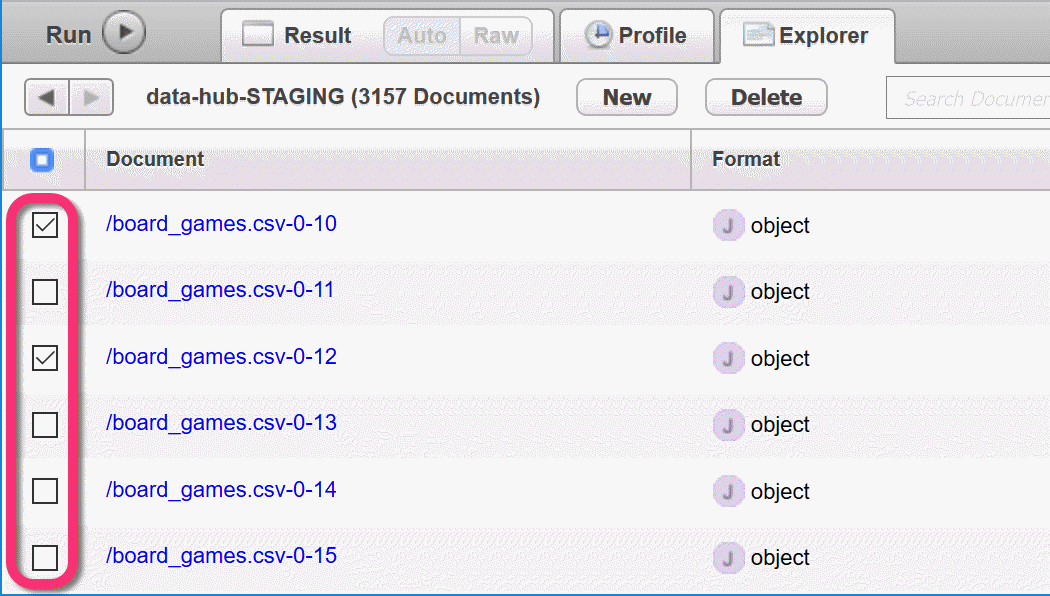
- Click the checkbox to the left of the URI name for each document to be deleted.
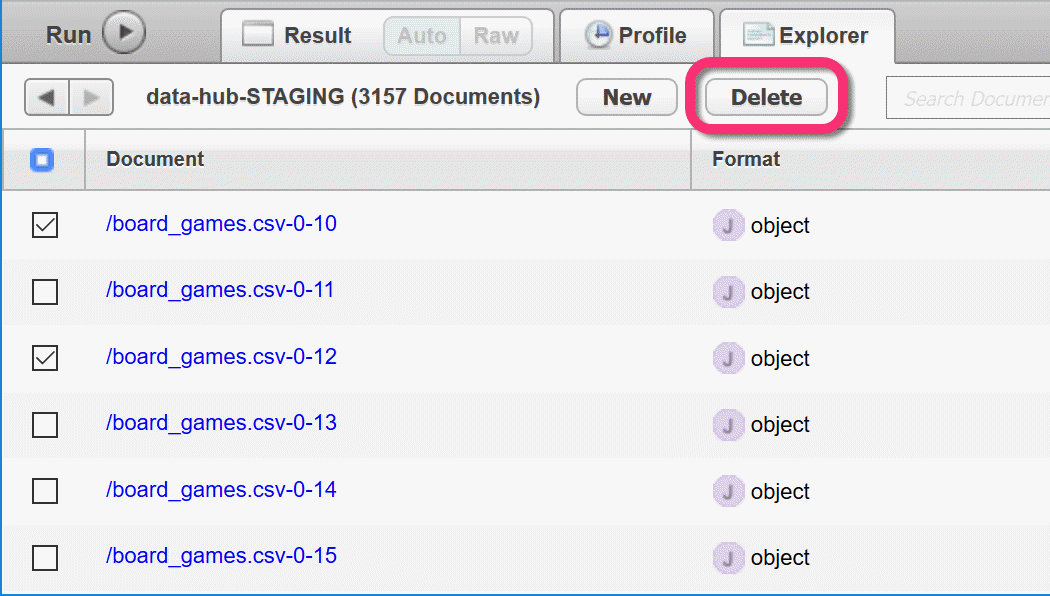
- Click Delete, at the top of the Explorer. The documents are deleted from the database.
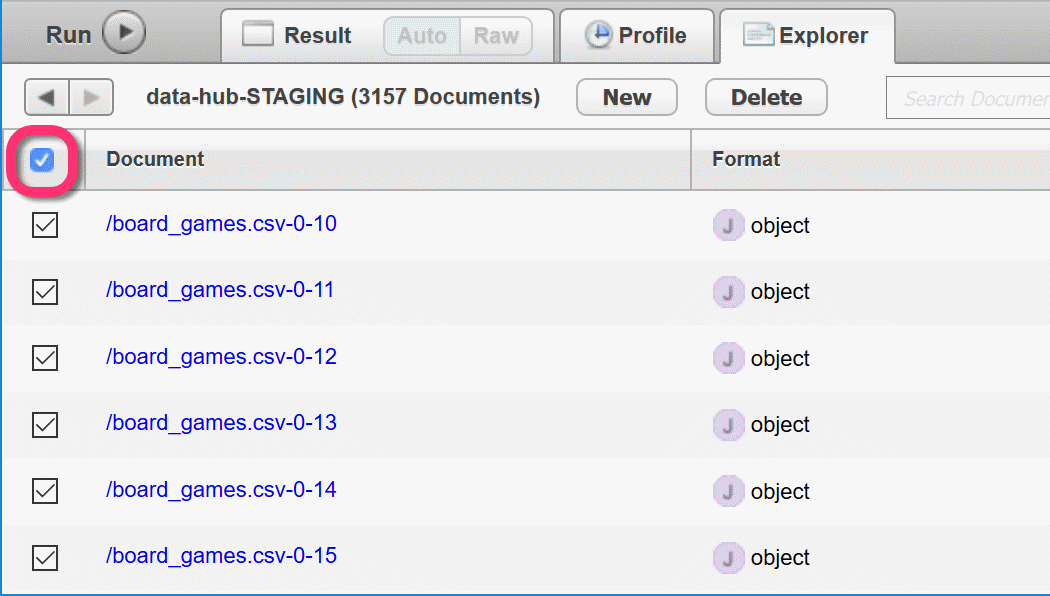
You can select all documents currently displayed by the Explorer by clicking the check box on column header:
Only documents with URIs shown in the document list are deleted. For example, if you filter the document list by URI or collection and select all, only the filtered list is affected. Similarly, if your database contains 100 documents, but only documents 1-50 are shown in the Explorer, then only documents 1-50 are selected for deletion.
Organizing Queries with Workspaces
In Query Console, you organize your queries in workspaces. You can create multiple workspaces. However, only one workspace is active at a time. When you create a new query, Query Console automatically saves it in the active workspace.
- Workspace Overview
- Renaming a Workspace
- Copying a Workspace
- Deleting a Workspace
- Exporting a Workspace
- Importing a Workspace
Workspace Overview
Use the workspace panel on the upper right of the page to interact with or change the active workspace. The workspace panel shows the name of the active workspace and lists the queries it contains:
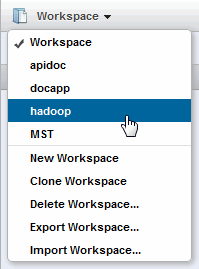
To see a list of available workspaces or to create, clone, delete, import or export a workspace, use the dropdown menu to the right of the workspace name:
Renaming a Workspace
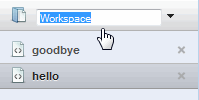
To rename a workspace, double-click on the workspace name at the top of the workspace panel:
Reorganizing a Workspace
You can re-order the list of queries in a workspace by dragging and dropping the query items in the workspace panel. You can also reorder queries in the editor panel by dragging and dropping the query tabs.
Copying a Workspace
To create a new workspace that contains the same queries as an existing workspace:
- If the source workspace is not the active workspace, make it the active workspace by selecting it in the workspace menu.
- Click Clone Workspace in the workspace menu. A new workspace named "Clone of workspace_name" is created and becomes the active workspace.
- To rename the new workspace, double-click on the name at the top of the workspace panel.
When you clone a workspace, all the queries in the original workspace are copied to the new workspace. Query histories are not copied.
Deleting a Workspace
To delete a workspace and all of the queries it contains:
- If the workspace to delete is not the active workspace, make it the active workspace by selecting it in the workspace menu.
- Click Delete Workspace in the workspace menu.
- Click OK in the confirmation dialog box to confirm deletion of the workspace.
If you delete the last workspace, Query Console automatically creates a workspace with the default initial contents.
Exporting a Workspace
Export a workspace to share it with another user or use it on a different MarkLogic Server instance. Exporting a workspace saves the workspace and queries to an external file which can be imported back into Query Console. Query history is not exported.
Importing a Workspace
To import a previously exported workspace into Query Console:
- Click Import Workspace in the workspace menu. The "Import a Workspace" dialog box appears.
- In the dialog box, click the Choose File button to select an exported workspace XML file.
To cancel the import, click anywhere outside the dialog box.
- Click
Importto load the workspace. A loading progress window displays. - When loading completes, the imported workspace becomes the active workspace.
If a workspace already exists with same name as the imported workspace, the imported workspace name is modified by appending a unique number to the name.


