MarkLogic Server 11.0 Product DocumentationMonitoring MarkLogic Guide — Chapter 2
Using the MarkLogic Server Monitoring Dashboard
This chapter describes how to use the Monitoring Dashboard. The Monitoring Dashboard provides task-based views of MarkLogic Server performance metrics in real time. The Monitoring Dashboard is intended to be used alongside the status pages in the Admin Interface and other monitoring tools that monitor application and operating system performance metrics.
The topics in this chapter are:
- Terms Used in this Chapter
- Displaying the Monitoring Dashboard
- Monitoring Specific Resources
- Monitoring Dashboard Sessions
- Setting the Sample Interval
- Viewing Monitoring Sample Details
- Monitoring Query Execution
- Monitoring Rates and Loads
- Monitoring Disk Space
- Exporting Monitoring Data
Terms Used in this Chapter
The following terms are used in this chapter:
- A Monitoring Session is the timeframe since the dashboard page was last refreshed. For example, if you navigate from the Query Execution page to the Rates and Loads page, you have ended the Query Execution session and started the Rates and Loads session.
- A Monitoring Sample is a bit of information captured during a refresh interval on a graph. For example, one of the candlesticks captured in the Query Execution graph is a single sample.
Displaying the Monitoring Dashboard
You can display the Monitoring Dashboard by doing the following:
- Open a browser and enter the URL:
http://monitor-host:8002/
where monitor-host is a host in the cluster you want to monitor
- At the top of the page, click on Monitoring and click on Dashboard in the pull-down menu:
Monitoring Specific Resources
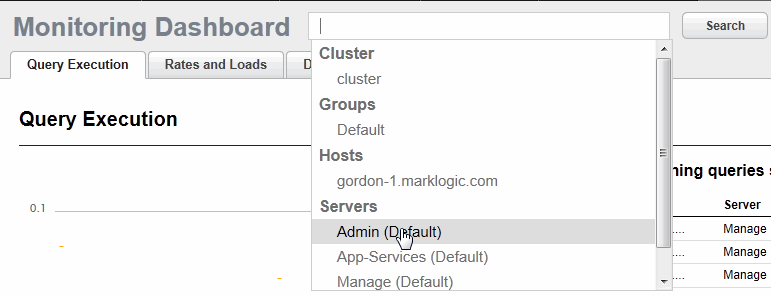
By default the Monitoring Dashboard monitors the entire cluster. You can use the Search box to select a specific resource to monitor. Clicking on the search field produces a pull-down menu in which you can locate the resource. Alternatively, you can directly locate a resource by entering the name of the resource in the search field.
Monitoring Dashboard Sessions
Each time you navigate to a new Dashboard page, you end the current monitoring session and begin a new one. The monitoring data from the previous session is lost from that point on. If you want to maintain multiple Dashboard sessions, you can open each page in a separate browser tab or window.
You can freeze the monitoring data for a Dashboard page by clicking on the Stop button in the upper right-hand portion of the page and restart the data by pressing Start. When you stop a page, you will lose any monitoring data between the time the page is stopped and the time it is restarted. If you have multiple Dashboard pages open, the sessions continue on the other pages; so stopping the monitoring data on one page will not stop the data on the other pages. When you start the stopped page, its session will resume at the current timestamp.
Setting the Sample Interval
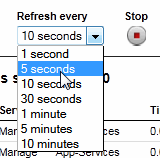
The sample interval specifies the frequency in which the selected resource is monitored. By default, the sample interval is every 10 seconds. Use the Refresh pull-down menu to set the sample interval from anything between once every 1 second to every 10 minutes.
If you have multiple Dashboard pages open in separate tabs or windows, changing the sample interval on one page will not change the interval on the other pages. However, if you switch between pages in the same browser tab or window, the interval will be the same for all pages.
Viewing Monitoring Sample Details
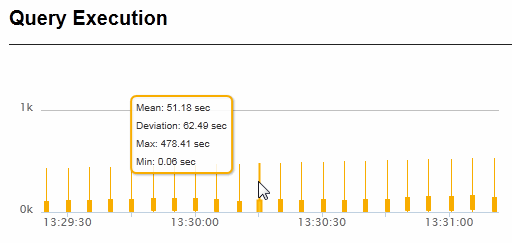
You can hover your mouse on any monitoring sample to view the details of the sample. For example, to view the details of a query execution sample, hover on the bar graphic as shown below.
Monitoring Query Execution
Query execution data gives you insight into the number of queries currently taking place and the execution time of these queries. Two important query execution metrics to monitor are:
- Query Execution Time -- Longer than usual query execution times may indicate a bottleneck, such as a slow host or problems with XDQP communication between hosts. Other possible problems include increased loads following a failover or more than the usual number of total requests.
- Total Requests -- A consistent increase in the total number of outstanding requests may indicate the need to add more capacity and/or load balance. Decreases in total requests may indicate some upstream problem that needs to be addressed.
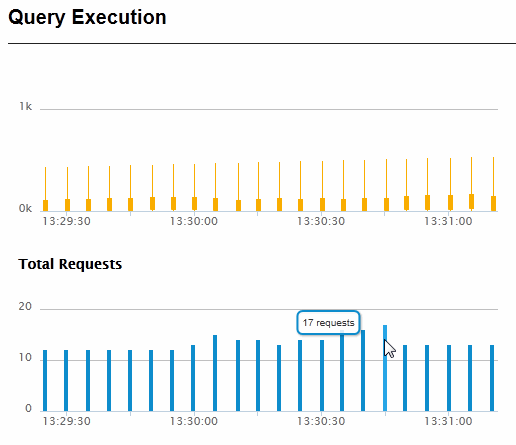
To display monitoring data related to query execution, select the Query Execution tab in the top left-hand portion of the Monitoring Dashboard.
The left side of the Query Execution page displays the maximum execution time (in seconds) of the current queries and the number of requests captured at each sample interval. You can hover a query execution sample to view the mean, maximum, and minimum execution times and the standard deviation from the mean.
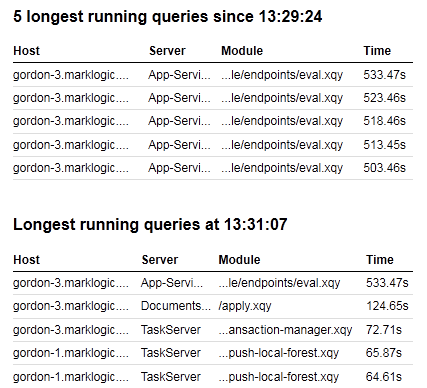
The right side of the Query Execution page displays the five longest running queries since the beginning of the session and the longest running queries at the current time.
Monitoring Rates and Loads
In general, rates and loads measure how efficiently data is exchanged between applications and MarkLogic Server. Rates and loads are defined as follows:
- Rates -- The amount of data (MB per second) currently being read from or written to MarkLogic Server.
- Loads -- The execution time (in seconds) of current read and write requests, which includes the time requests spend in the wait queue when maximum throughput is achieved.
For details on how to interpret rates and loads, see What is Happening on the MarkLogic Server Cluster Now?.
To display monitoring data related to rates and loads, select the Rates and Loads tab in the top left-hand portion of the Monitoring Dashboard.
There are three types of rates and loads monitoring data. Select the type of rates and loads data by clicking on one of the three buttons displayed under Rates and Loads:
The monitoring data displayed by each of these buttons is described in the following sections:
Overview
To obtain rates and loads data for queries, merges, and large data, click on the Overview button:
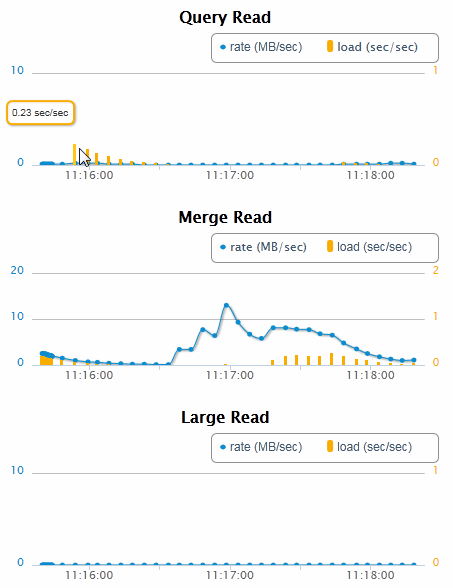
The left-hand side of the Rates and Loads Overview page displays the monitoring data related to query, merge, and large data reads.
For details on Large Data, see Working With Binary Documents in the Application Developer's Guide.
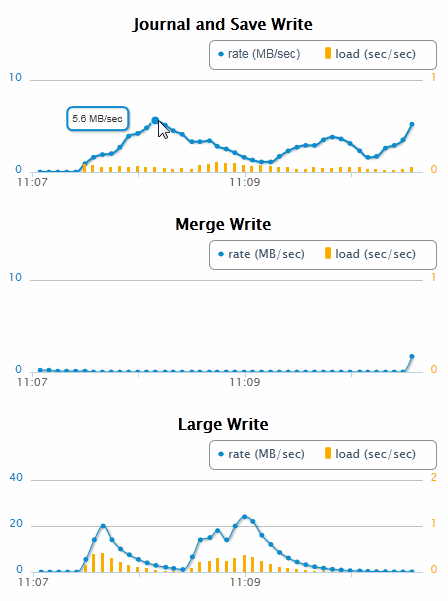
The right-hand side of the Rates and Loads Overview page displays the monitoring data related to journal and save, merge, and large data writes.
XDQP Communication
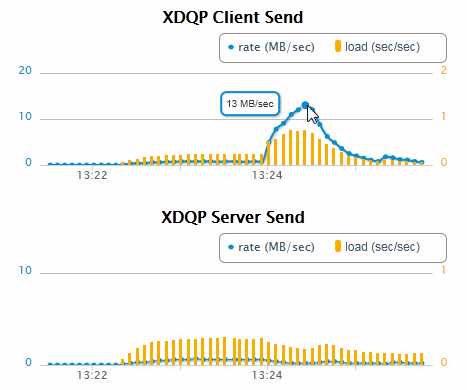
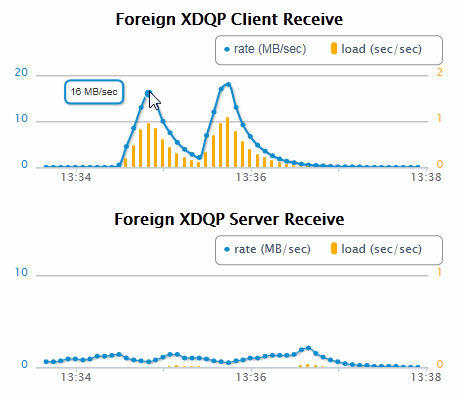
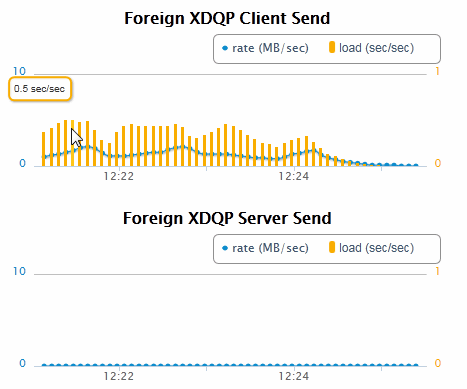
Communication between MarkLogic Server hosts within a cluster and between hosts in different clusters is done using the XDQP protocol. Both the rate and load are displayed for each sample interval. Unusually high XDQP loads may indicate a network connection problem.
To monitor the rates and loads related to XDQP communication, click on the XDQP Communication button:
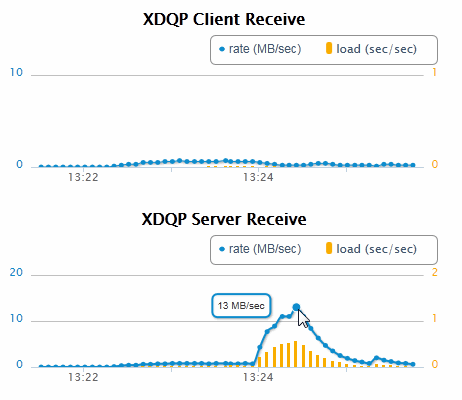
The upper left-hand side of the XDQP Communication page displays the monitoring data related to XDQP data received by the client and server.
The upper right-hand side of the XDQP Communication page displays the monitoring data related to XDQP data sent by the client and server.
The lower left-hand side of the XDQP Communication page displays the monitoring data related to XDQP data received by the client and server from a foreign cluster.
The lower right-hand side of the XDQP Communication page displays the monitoring data related to XDQP data sent by the client and server to a foreign cluster.
Backup/Restore
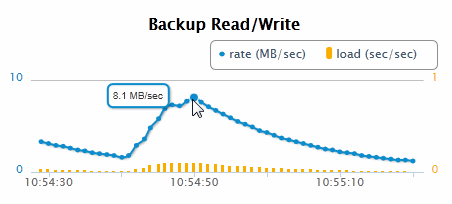
Backup and restore processes can impact the performance of applications and other background tasks in MarkLogic Server, such as merges and indexing.
To monitor the rates and loads related to backup and restore operations, click on the Backup/Restore button:
The left-hand side of the Backup/Restore page displays the monitoring data related to Backup reads and writes.
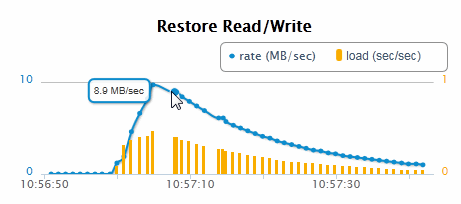
The right-hand side of the Backup/Restore page displays the monitoring data related to Restore reads and writes.
Monitoring Disk Space
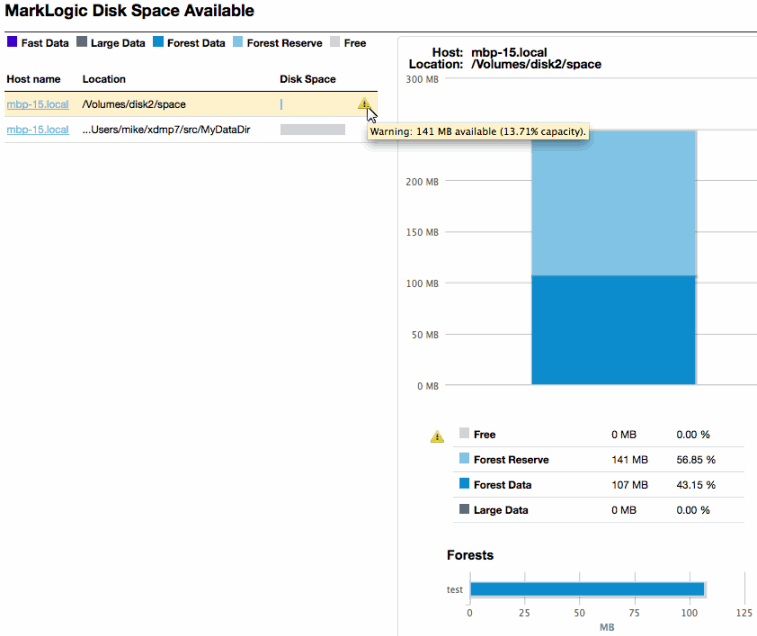
Disk space usage is a key monitoring metric. In general, forest merges require twice as much disk space than that of the data stored in the forests. If a merge runs out of disk space, it will fail. In addition to the need for merge space on the disk, there must be sufficient disk space on the file system in which the log files reside to log any activity on the system. If there is no space left on the log file device, MarkLogic Server will abort. Also, if there is no disk space available to add messages to the log files, MarkLogic Server will fail to start.
To display monitoring data related to disk space, select the Disk Space tab in the top left-hand portion of the Monitoring Dashboard.
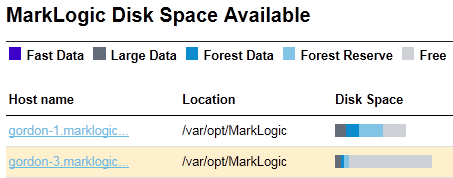
The data displayed on the Disk Space is for a specific host. You can select the host in the upper- left-hand section of the Disk Space page. The hosts in this list are sorted by those with the least available disk space at the top.
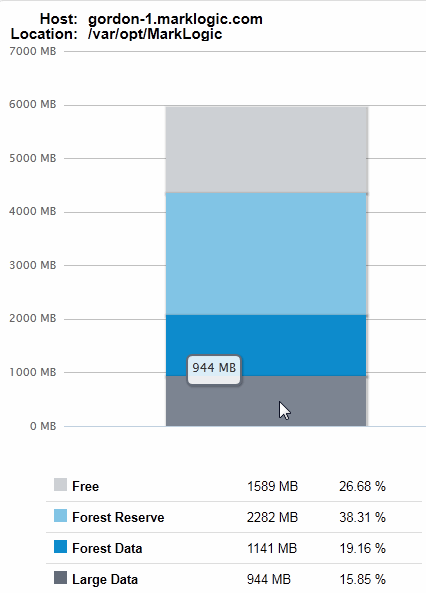
The disk space monitoring metrics are:
- Fast Data -- The amount of disk space used by the forests' Fast Data Directory. The Fast Data Directory is typically mounted on a specialized storage device, such as a solid state disk. Fast data consists of transaction journals and as many stands that will fit on the fast storage device. For more information on Fast Data, see Fast Data Directory on Forests in the Query Performance and Tuning Guide.
- Large Data -- The amount of disk space used by the forests' Large Data Directory. The Large Data Directory contains binary files that exceed the 'large size threshold' property set for the database. Large Data is not subjected to merges so, unlike Forest Data, Large Data does not require any additional Forest Reserve disk space. For more information on Large Data, see Working With Binary Documents in the Application Developer's Guide.
- Forest Data -- The amount of disk space used by the data in the forest stands. This data is subject to periodic merges.
- Forest Reserve -- The amount of free disk space that should be held in reserve to enable MarkLogic Server to merge the Forest Data.
- Free -- The amount of free space on the disk that remains after accounting for the Forest Reserved space.
The upper right-hand section of the Disk Space page displays the amount of free space on the disk, along with how much reserve space is reserved for forest merges and the actual amount of space currently used by the forests and large data.
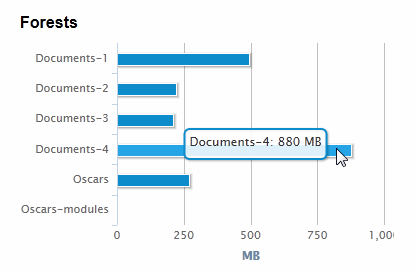
The lower right-hand section of the Disk Space page displays the amount of space on the disk used by the individual forests.
If your disk has less than 15% capacity a warning message is generated, as shown below. If the capacity falls to less than 10%, a critical message is generated.
Exporting Monitoring Data
Each of the three tabbed Monitoring Dashboard pages (Disk Space, Query Execution, Rates and Loads) has an Export button in its upper right corner, on the same line as the current tab's name. When clicked, it exports the page's data to a local XML file, formatted to be openable in Excel.
The exported files have tab-specific names incorporating a timestamp of when the file was exported. For example:
disk-space-20120210-160945.xml
indicates that it contains a page of data from the Disk Space tab, exported on February 10th, 2012 (2012 02 10) at 4:09:45 p.m. (16 09 45) (spaces added in this paragraph for clarity).
The exported data is from a JavaScript cache that automatically accumulates data as the page is drawn and refreshed. Two of the tabbed pages, Query Execution and Rates and Loads, accumulate data over time. A maximum1000 latest data points are cached for each of these pages, no matter how long the monitor page runs.
By default, data is cached every 10 seconds. This rate depends on the polling interval, which is set on the Dashboard page within the Refresh drop-down menu. See Setting the Sample Interval.
When using the Export button, remember these caveats:
- The cache is not in a persistent file, so manually refreshing the browser clears it of all accumulated data. Immediately after a manual browser refresh, there is no data to export.
- Clicking Export returns only the data from the current tab's page. For example, if you are on the Query Execution tab, clicking Export only writes out data from Query Execution and does not write out data from the Rates and Loads or Disk Space tabs. To get the values from all three tabs, you have to go to each tab and click its Export button, resulting in three separate files.
- However, when clicking Rates and Loads' Export button, the file does contain the data from all three of Rates and Loads' sub-tabs (Overview, XDQP Communication, and Backup/Restore).
Previously, you had to turn on caching this data with a debug=true parameter in the browser URL. Now, data is cached by default.


