MarkLogic Server 11.0 Product DocumentationConcepts Guide — Chapter 9
Administrating and Monitoring MarkLogic Server
This chapter describes the tools available for configuring and monitoring a MarkLogic cluster. The topics are as followings:
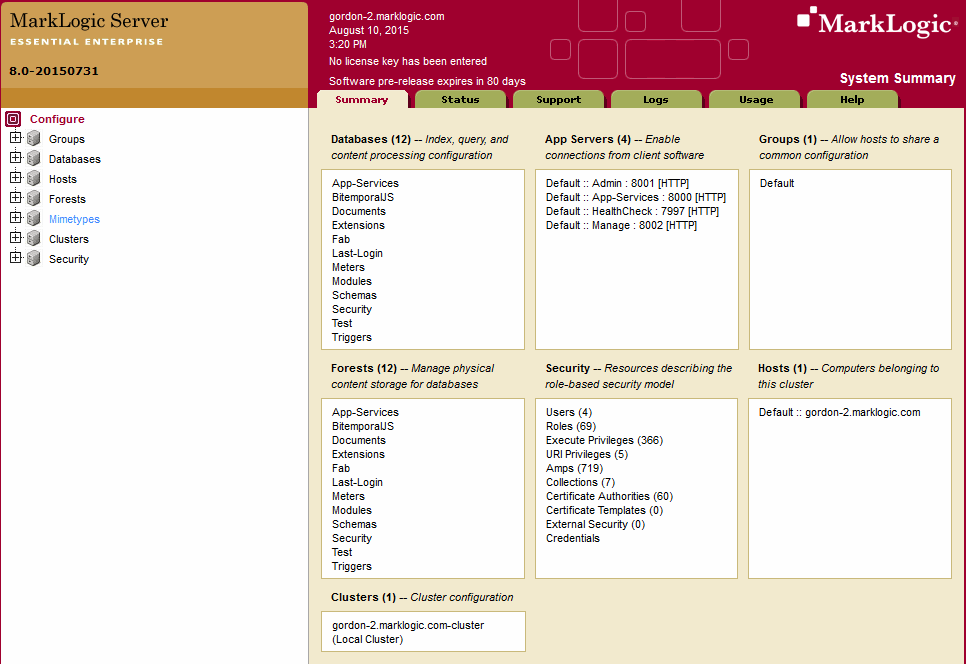
Administration Interface
The Administration Interface (Admin Interface) is graphic user interface for managing MarkLogic Server and is implemented as a web application that runs in your browser.
With the Admin Interface, you can complete any of the following tasks:
- Manage basic software configuration
- Create and configure groups
- Create and manage databases
- Create and manage new forests
- Backup and restore forest content
- Create and manage new web server and Java-language access paths
- Create and manage security configurations
- Tune system performance
- Configure namespaces and schemas
- Check the status of resources on your systems
Users with the admin role, known as authorized administrators, are trusted personnel and are assumed to be non-hostile, appropriately trained, and follow proper administrative procedures.
For detailed procedures on using the Admin Interface, see the Administrator's Guide.
Administration APIs
The MarkLogic Admin APIs provide a flexible toolkit for creating new and managing existing configurations of MarkLogic Server. The Admin APIs take the following forms:
The common use cases of the Admin APIs include.
- Configuring multiple, identical instances of MarkLogic Server (across a cluster or multiple clusters and/or to maintain consistency between development, certification and production environments).
- Automating Server Maintenance. For example, backups based on criteria other than a schedule.
- Managing server resources. For example, delete-only forest rotation.
- Making Bulk Updates to Server Configuration. For example, changing roles across a large subgroup of users.
- Generating notifications (log and/or email) for specific server events.
The Scripting Administrative Tasks Guide provides code samples that demonstrate the various uses of the MarkLogic Server Administration APIs.
Monitoring Tools
MarkLogic provides a rich set of monitoring features that include pre-configured monitoring and monitoring history dashboards, plugins that allow you to monitor MarkLogic with a Management API that allows you to integrate MarkLogic with existing monitoring applications or create your own custom monitoring applications.
In general, you will use a monitoring tool for the following:
- To keep track of the day-to-day operations of your MarkLogic Server environment in realtime.
- Capture historical performance metrics.
- For initial capacity planning and fine-tuning your MarkLogic Server environment. For details on how to configure your MarkLogic Server cluster, see the Scalability, Availability, and Failover Guide.
- To troubleshoot application performance problems. For details on how to troubleshoot and resolve performance issues, see the Query Performance and Tuning Guide.
- To troubleshoot application errors and failures.
MarkLogic includes the following monitoring tools:
- A Monitoring dashboard that monitors MarkLogic Server. This dashboard is pre-configured to monitor specific MarkLogic Server metrics. For details, see Using the MarkLogic Server Monitoring Dashboard in the Monitoring MarkLogic Guide.
- A Monitoring History dashboard to capture and make use of historical performance data for a MarkLogic cluster. For details, see MarkLogic Server Monitoring History in the Monitoring MarkLogic Guide.
- A RESTful Management API that you can use to integrate MarkLogic Server with existing monitoring application or create your own custom monitoring applications. For details, see Using the Management API in the Monitoring MarkLogic Guide.
Telemetry
MarkLogic telemetry provides faster, more complete communication with MarkLogic Support to facilitate the resolution of issues. When telemetry is enabled, it collects, encrypts, and sends diagnostic and anonymized system-level information about a MarkLogic cluster to a secure MarkLogic destination. Telemetry collects only system-level information, and sends it to a protected and secure location, where it can only be accessed by the MarkLogic technical teams to facilitate troubleshooting and monitor performance.
You can enable/disable each data type that you allow to be transmitted: Log data, Metering data, Configuration files, and Support Request data. Telemetry does not collect user data or application logs. At all times, information collected through telemetry is handled in accordance with the MarkLogic Privacy Policy available at http://www.marklogic.com/privacy-policy/. You can preview the monitoring data to be sent either by viewing it in a browser or saving it to a local file. For more information, see Telemetry in the Monitoring MarkLogic Guide.

