Monitor query execution
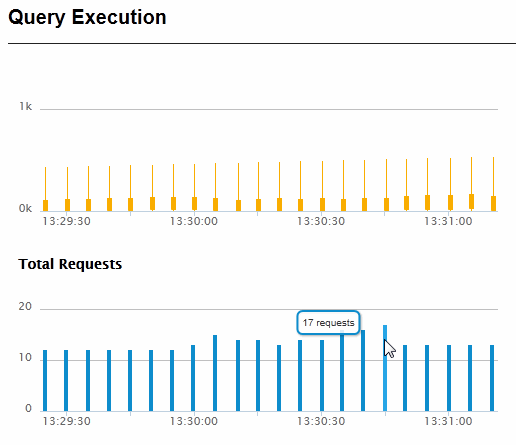
Query execution data gives you insight into the number of queries currently taking place and the execution time of these queries. Two important query execution metrics to monitor are:
Query Execution Time — Longer than usual query execution times may indicate a bottleneck, such as a slow host or problems with XDQP communication between hosts. Other possible problems include increased loads following a failover or more than the usual number of total requests.
Total Requests — A consistent increase in the total number of outstanding requests may indicate the need to add more capacity and/or load balance. Decreases in total requests may indicate some “upstream” problem that needs to be addressed.
To display monitoring data related to query execution, select the Query Execution tab in the top left-hand portion of the Monitoring Dashboard.
The left side of the Query Execution page displays the maximum execution time (in seconds) of the current queries and the number of requests captured at each sample interval. You can hover a query execution sample to view the mean, maximum, and minimum execution times and the standard deviation from the mean.

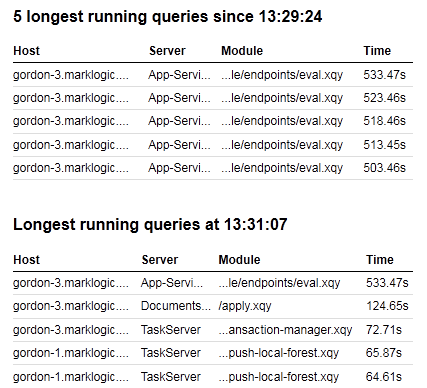
The right side of the Query Execution page displays the five longest running queries since the beginning of the session and the longest running queries at the current time.
