View staged telemetry files
To see the files being staged locally for telemetry, navigate to /var/opt/MarkLogic/Stage/Logs. Type tail -f ErrorLog.txt |grep -i telemetry and press return. When telemetry is enabled this will show a running log of the data being that is being collected and uploaded every 5 minutes.
This example shows when data that has been sent to telemetry:
[localhost Logs]$ tail -f ErrorLog.txt |grep -i telemetry
2021-08-25 16:36:47.001 Info: Uploaded 47 records, 1 MB of Config Files to Telemetry
2021-08-25 16:36:47.972 Info: Uploaded 4 records, 1 MB of Meters Data to Telemetry
2021-08-25 16:36:48.794 Info: Uploaded 64 records, 1 MB of Error Logs to Telemetry
2021-08-25 16:37:03.169 Info: Uploaded 1 records, 1 MB of Usage Data to Telemetry
You can also view the data that is being collected in the log files using Query Console. Type the following into the Query Console:
xdmp:logfile-scan("/var/opt/MarkLogic/Logs/ErrorLog.txt")
The output will look similar to this:
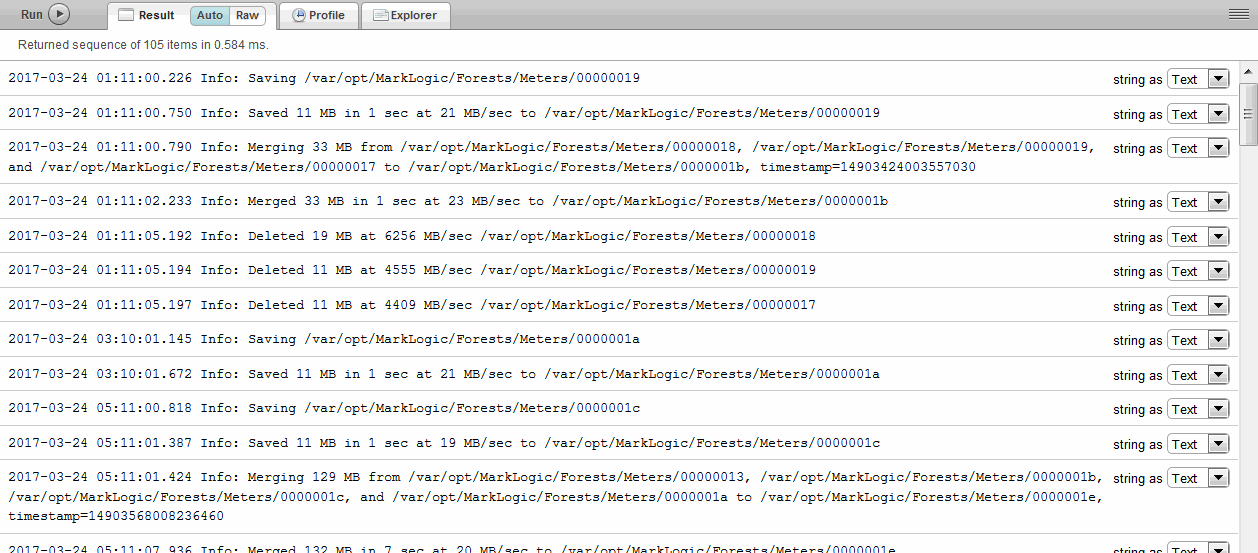 |
Note
Checking the locally staged log files will not work if you have encryption at rest enabled for log files. See Configuration File and Log File Encryption Options in Securing MarkLogic Server for more information.
To see the log data being collected for telemetry (which may different from the file log ErrorLog.txt data due to different log file settings), use this query:
xdmp:logfile-scan("/var/opt/MarkLogic/Stage/Logs/ErrorLog.txt")