I/O performance data
The Overview page displays a graph of the aggregate I/O performance data for the files used by the hosts selected in the filter. As described in View monitoring history, you can hover on a period point to view what file operation was taking place at that point in time. Each performance metric is described in the following table.
Metric |
Description |
|---|---|
Query Reads |
The file I/O performance during a query read operation. |
Journal Writes |
The file I/O performance during journal write operations. |
Save Writes |
The file I/O performance during save write operations. |
Merge Reads |
The file I/O performance during a merge read operation. |
Merge Writes |
The file I/O performance during a merge write operation. |
Backup Reads |
Throughput of reading backup data, in megabytes per second. |
Backup Writes |
Throughput of writing data for backups, in megabytes per second. |
Restore Reads |
Disk read throughput for restore, in megabytes per second. |
Restore Writes |
Disk writing throughput for restore, in megabytes per second. |
Click on the arrow in the upper left-hand section of the I/O graph in the Overview page to view charts that present more detailed disk performance metrics.
The metrics displayed by the charts on the FILE I/O PAGE page are described in the following table.
Chart |
Definition of Displayed Metric |
|---|---|
Query Read Rate |
The moving average of reading query data from disk |
Journal Write Rate |
The moving average of data writes to the journal. |
Save Write Rate |
The moving average of data writes to in-memory stands. |
Merge Read Rate |
The moving average of reading merge data from disk |
Merge Write Rate |
The moving average of writing data for merges |
Backup Read Rate |
Throughput of reading backup data from disk, in megabytes per second. |
Backup Write Rate |
Throughput of writing data for backups, in megabytes per second. |
Restore Read Rate |
Disk read throughput for restore, in megabytes per second. |
Restore Write Rate |
Disk writing throughput for restore, in megabytes per second. |
Large Binary Read Rate |
The moving average of reading large documents from disk. |
Large Binary Write Rate |
The moving average of writing data for large documents to disk. |
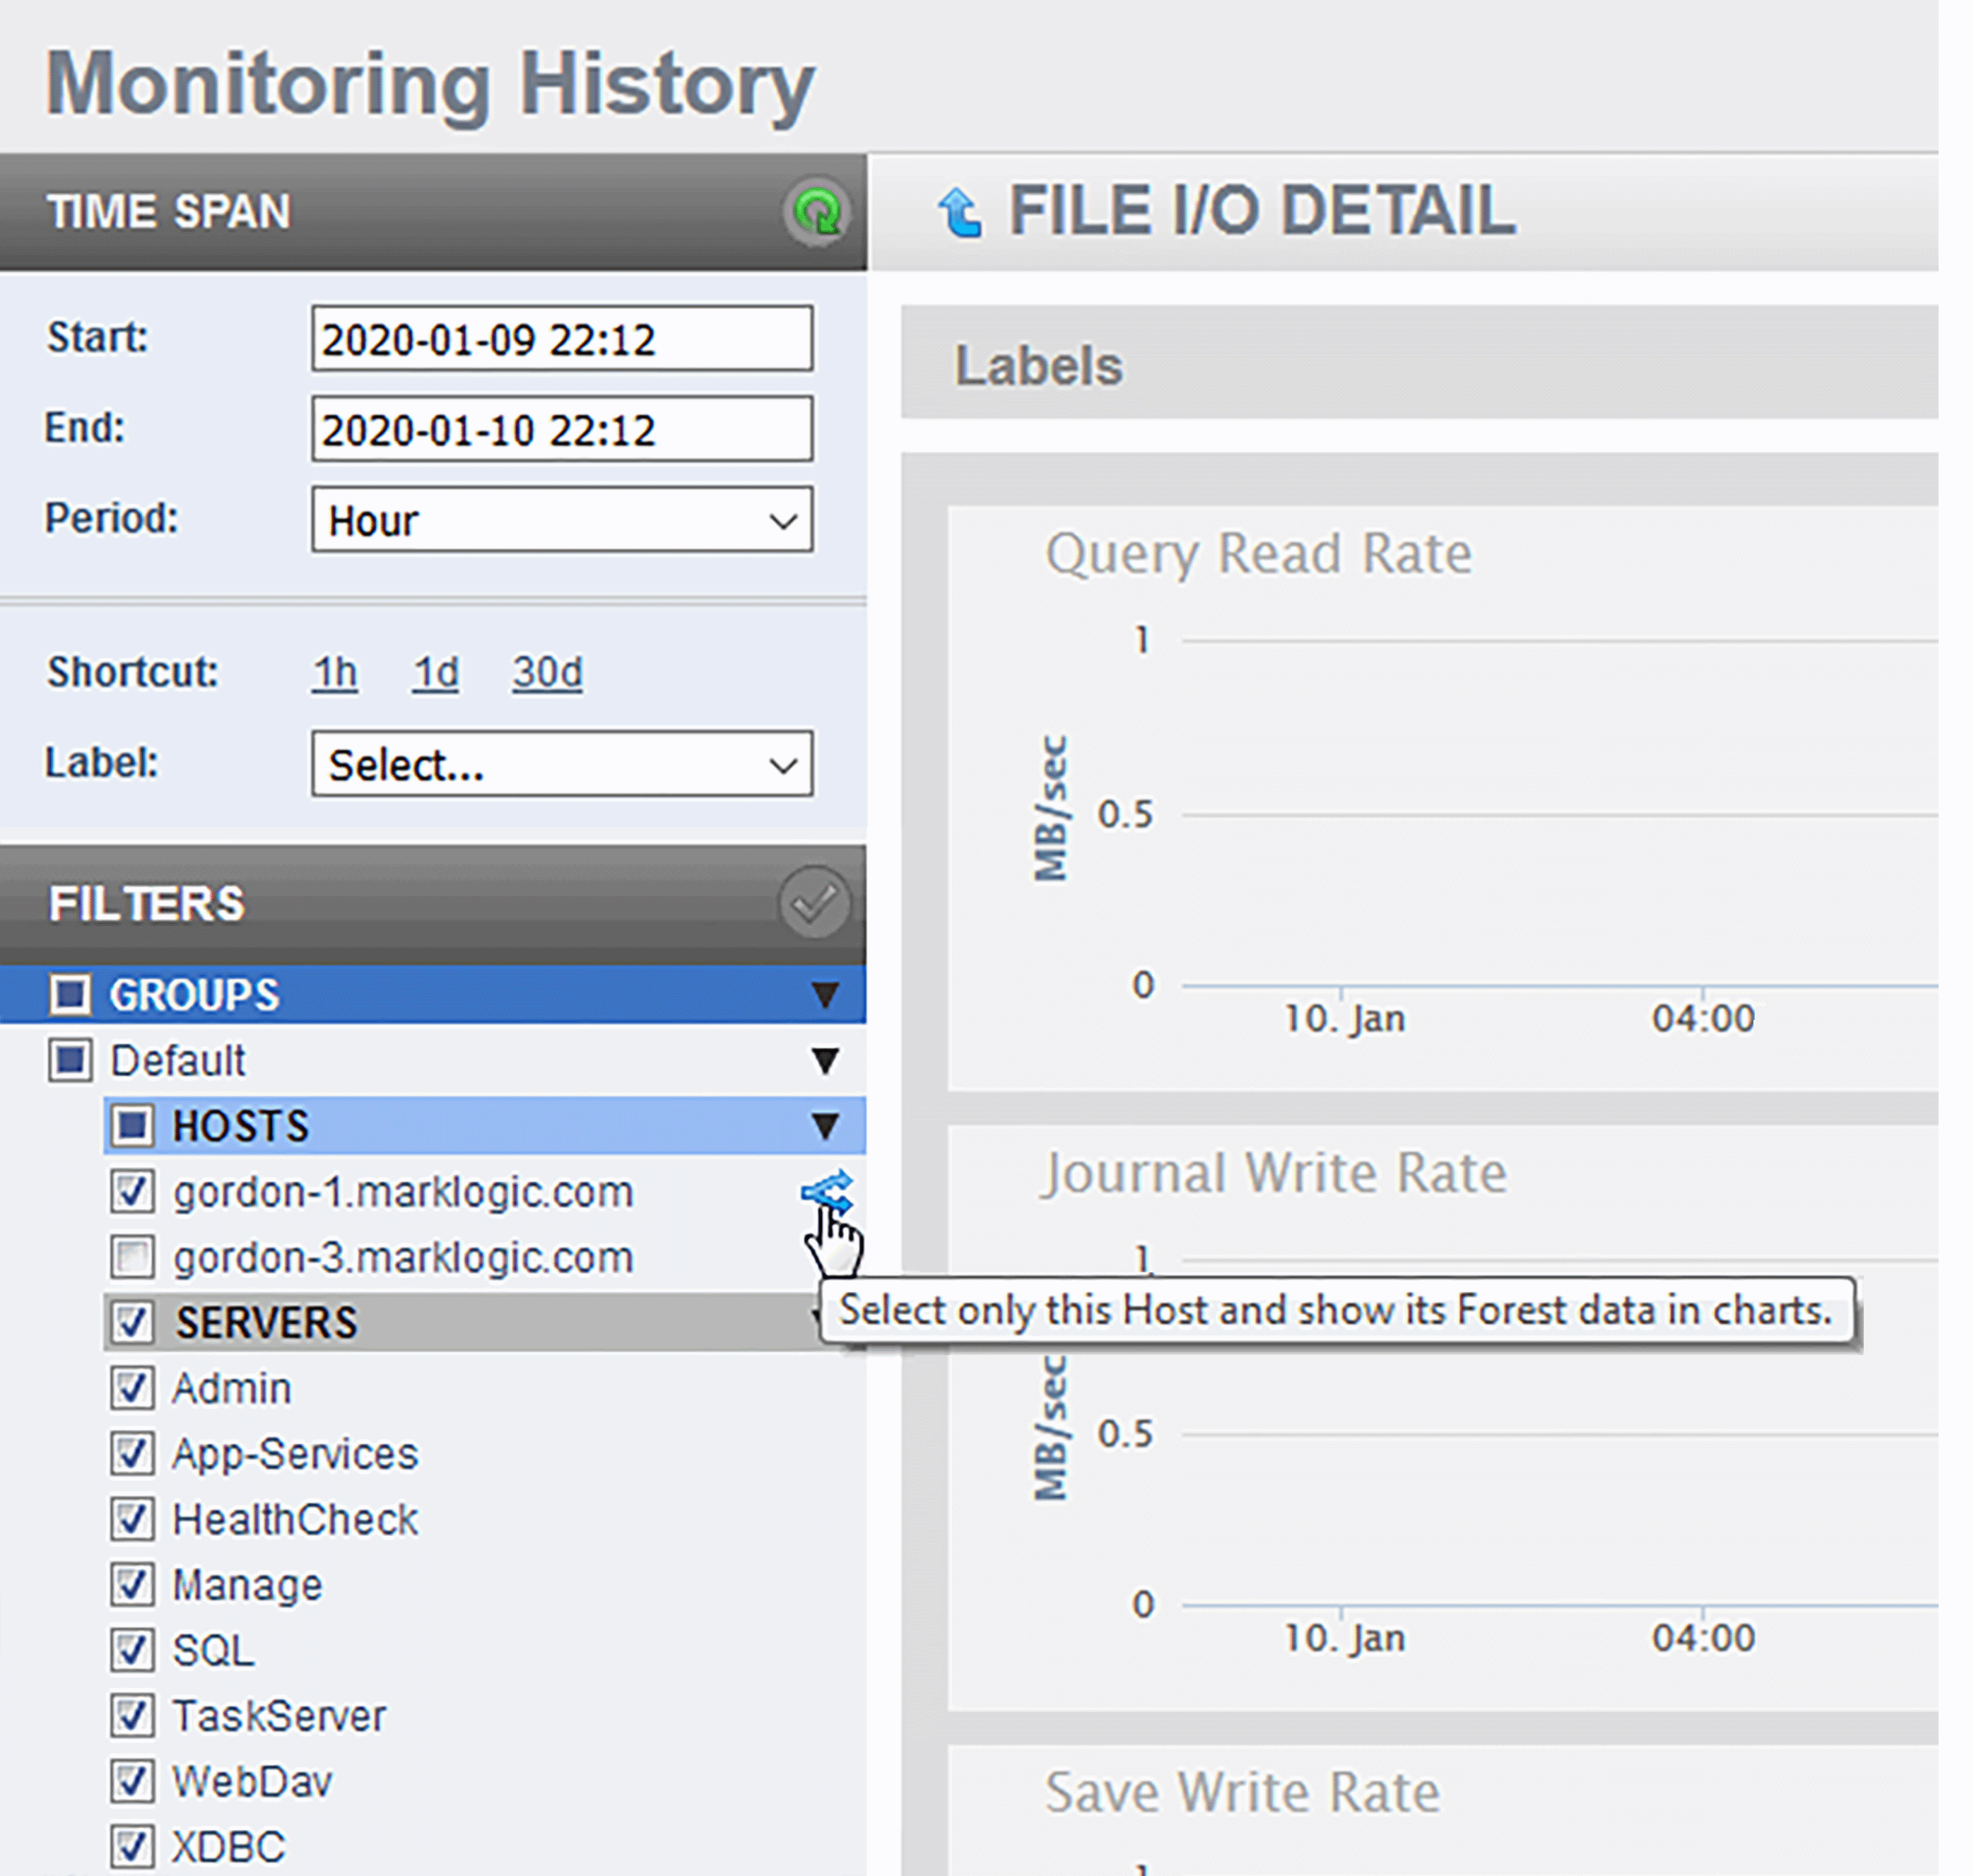
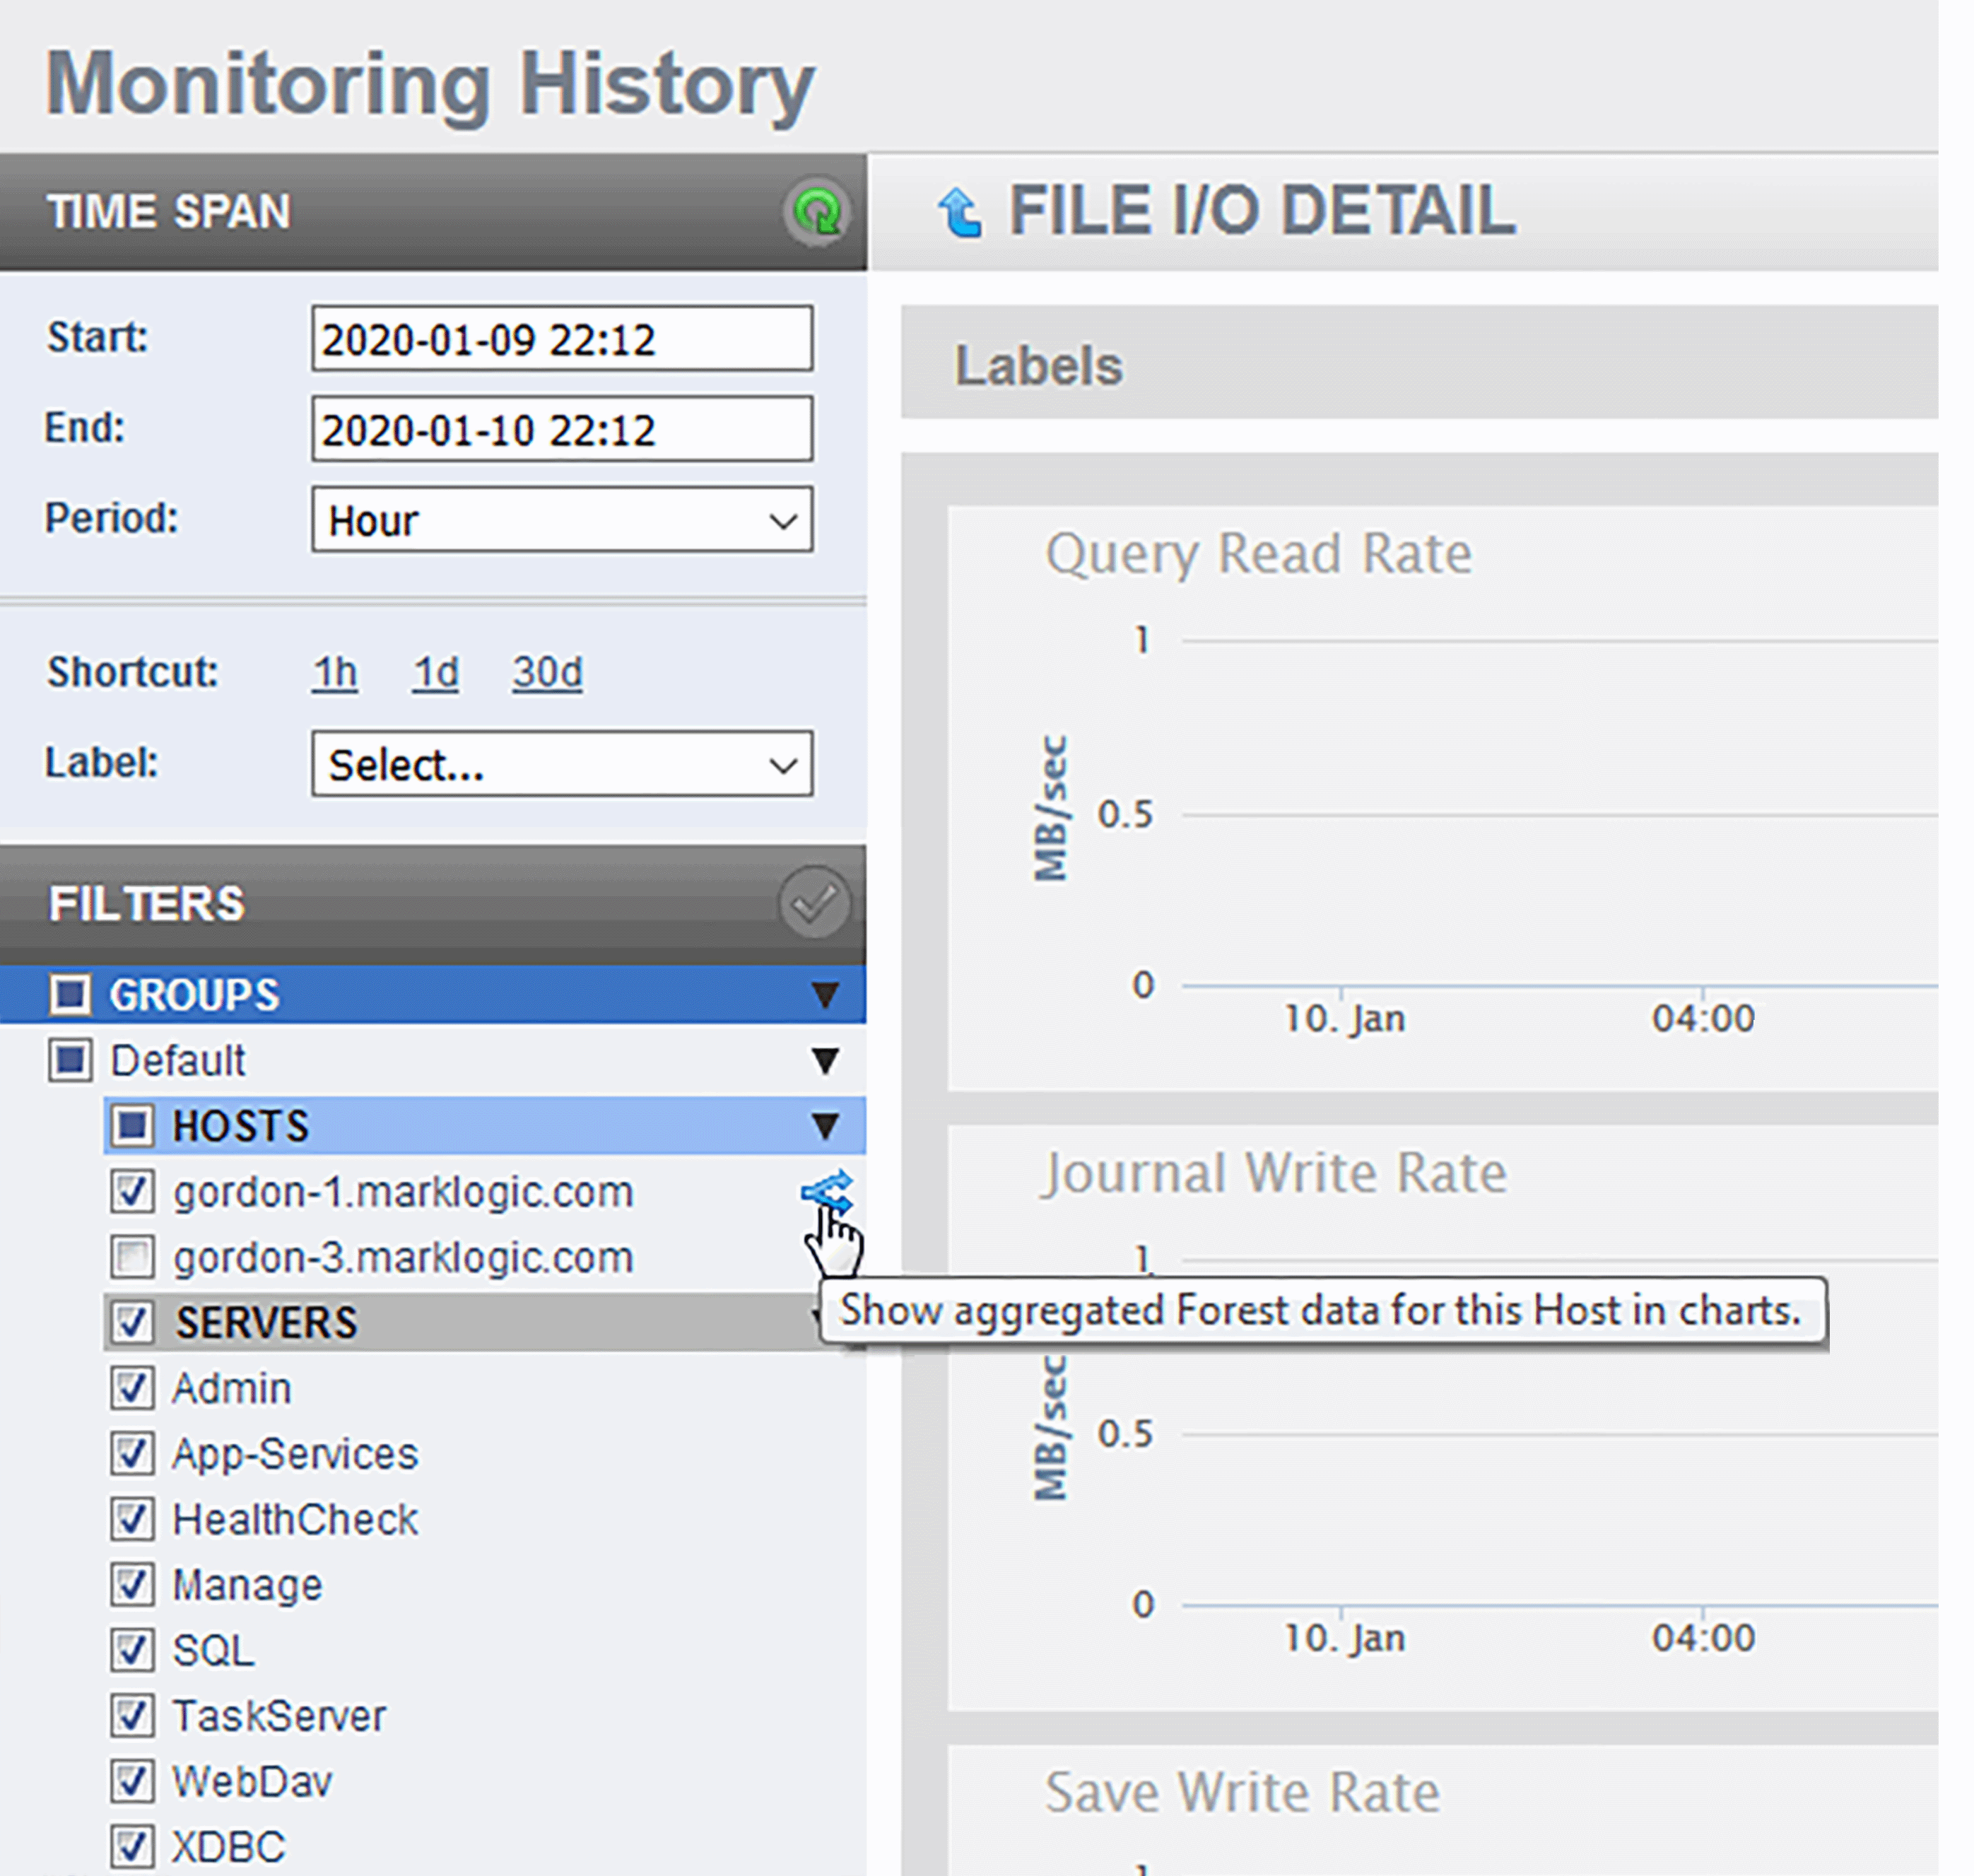
By default, Host data is viewed in aggregated form and must be viewed that way if multiple hosts are selected. When in the FILE I/O DETAIL page, you can rollover any Host filter to reveal the Select and Expand button. This will deselect all of the other Hosts across all Groups, and apply all pending filter changes. The expanded charts display the data for each forest in that host as separate line in each chart.

To return to the aggregate view, click on Aggregate button on an expanded Host. Doing so will also apply all pending filter changes to the displayed charts.
